
INTRODUCTION
I hope this letter finds you and your family safe and healthy.
From a social perspective, these past few months have been difficult. The disruption, while necessary, has altered many daily pre-COVID-19 routines. Notably absent from my routine is entertainment, particularly sports. If you did not know, I am a basketball fan. Growing up, following the latest developments in the NBA was a daily ritual. I could tell you who led in scoring, rebounds, assists and blocks. I enjoyed watching the greatest players lace them up and compete against each other. Some of the most exciting games in NBA history happened during the 1990s.
During that decade the New York Knicks were a dominate force. If you are a New York Knicks fan, then you are familiar with Reggie Miller of the Indiana Pacers. Playing in Madison Square Garden, home of the NY Knicks, seemed to bring out the best in players. During the 1995 playoffs, Reggie, singlehandedly, scored 8 points in 9 seconds. Yes, 8 points in 9 seconds! He hit two free throws and two 3-point shots (one off of an in-bounds steal) to seal the game. I remember watching the game in awe. It is one of the greatest comebacks in NBA history. 25 years later, it is still one of the legendary moments in sports.
During the 1st quarter of 2020, the S&P 500 had the fastest drop into bear market territory on record, suffering a peak-to-trough decline of (-34%). However, like Reggie Miller during the ’95 playoffs, the S&P 500 returned 45% from the March low until June 8th, staging a remarkable comeback. One wonders if we’ll be talking about this turnaround 25 years from now.
While many sports are sidelined right now, Mountain Vista has not taken a time-out. We remain diligent and committed to our clients. We are proud to provide you with uninterrupted, high-quality service. Thank you for your continued trust, and if you see Reggie out there, tell him we still remember.
Be well,

Michael J. Riolo
Director of Financial Planning
OVERALL MARKET COMMENTARY
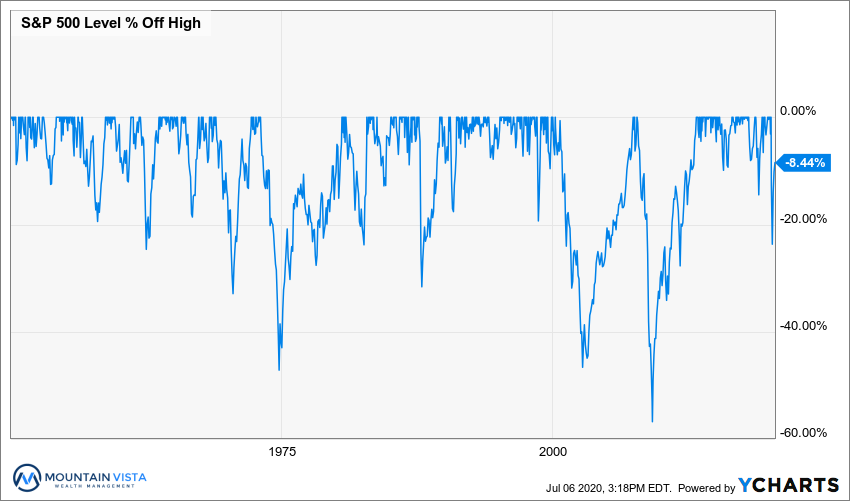
The historical return of the U.S. equity market has been approximately 10%. What some fail to appreciate is how windy the path has been to earning those returns. Below is a chart showing the price declines of the S&P 500 from the most recent high since 1950. As you can see in Figure 1, declines of 5% happen with great frequency, 15-20% every 6 or 7 years and 30% or worse somewhat rarely. Unfortunately, the occasional drawdowns, some being meaningful, are the price of admission to earning the 10% returns.
As we learned once again in 2020, keeping a level head when markets are depressed is imperative to earning strong long-term returns. Just as important is not chasing a hot market, only to find yourself overexposed when the sentiment unavoidably changes.
Figure 1: S&P 500 Drawdowns Since 1950
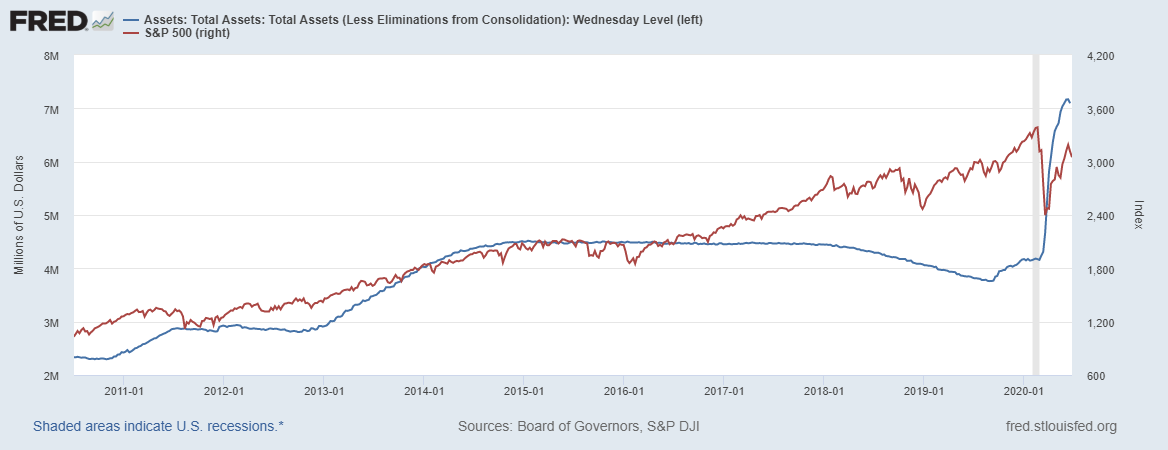
At the end of the 1st quarter, few would have expected the S&P 500 to be close to breakeven for the year three months later. The drop into bear market territory was the fastest on record and the speed of the subsequent rally has been nearly as impressive. From March 23rd to June 8th, the S&P 500 returned over 45%, leaving it down only (-3%) year-to-date. Actions taken by Federal, State and Local governments to stem the spread of the virus and bolster support available to American citizens and companies helped the market find a bottom. More importantly though were the actions taken by the Federal Reserve are what have allowed the markets to recover swiftly and without too much hesitation.
The Federal Reserve moved quickly and decisively, announcing no fewer than 9 emergency lending programs over late March and early April. In three months’ time, they increased the assets held on their balance sheet by over 70%. Furthermore, whenever the market hit a speed bump, Chairman Jerome Powell quickly reiterated that the Fed had much more firepower and supportive policies will continue until employment is back to normal levels.
Figure 2: Federal Reserve Balance Sheet and S&P 500
While extreme actions were definitely necessary, given the unique and precarious scenario we found ourselves in, one must ask what the end game is to all of this stimulus. Markets have decoupled from current economic fundamentals in a significant way. While, it is possible that we experience a true “v-shaped” recovery and that the market has looked through the downturn, I find it hard to believe that certain sectors (restaurants, movie theaters, airlines, etc.) are not going to be impacted for a meaningful amount of time. FactSet forecasts S&P earnings to be down 21.6% in 2020.
More likely, low treasury yields and massive balance sheet expansion have crowded out private investors, forcing them to search for positive real returns in riskier investments. The end result is rich valuations across all assets. With valuations so reliant upon the monetary support to justify their inflated levels, the removal of accommodation is likely to be met with bouts of volatility. If Main Street does not improve commensurate with markets, we expect increasing anger over wealth inequality and the Federal Reserve policies that benefit Wall Street over Main Street. This may force the Fed to reduce support prematurely, causing a disruption to markets.
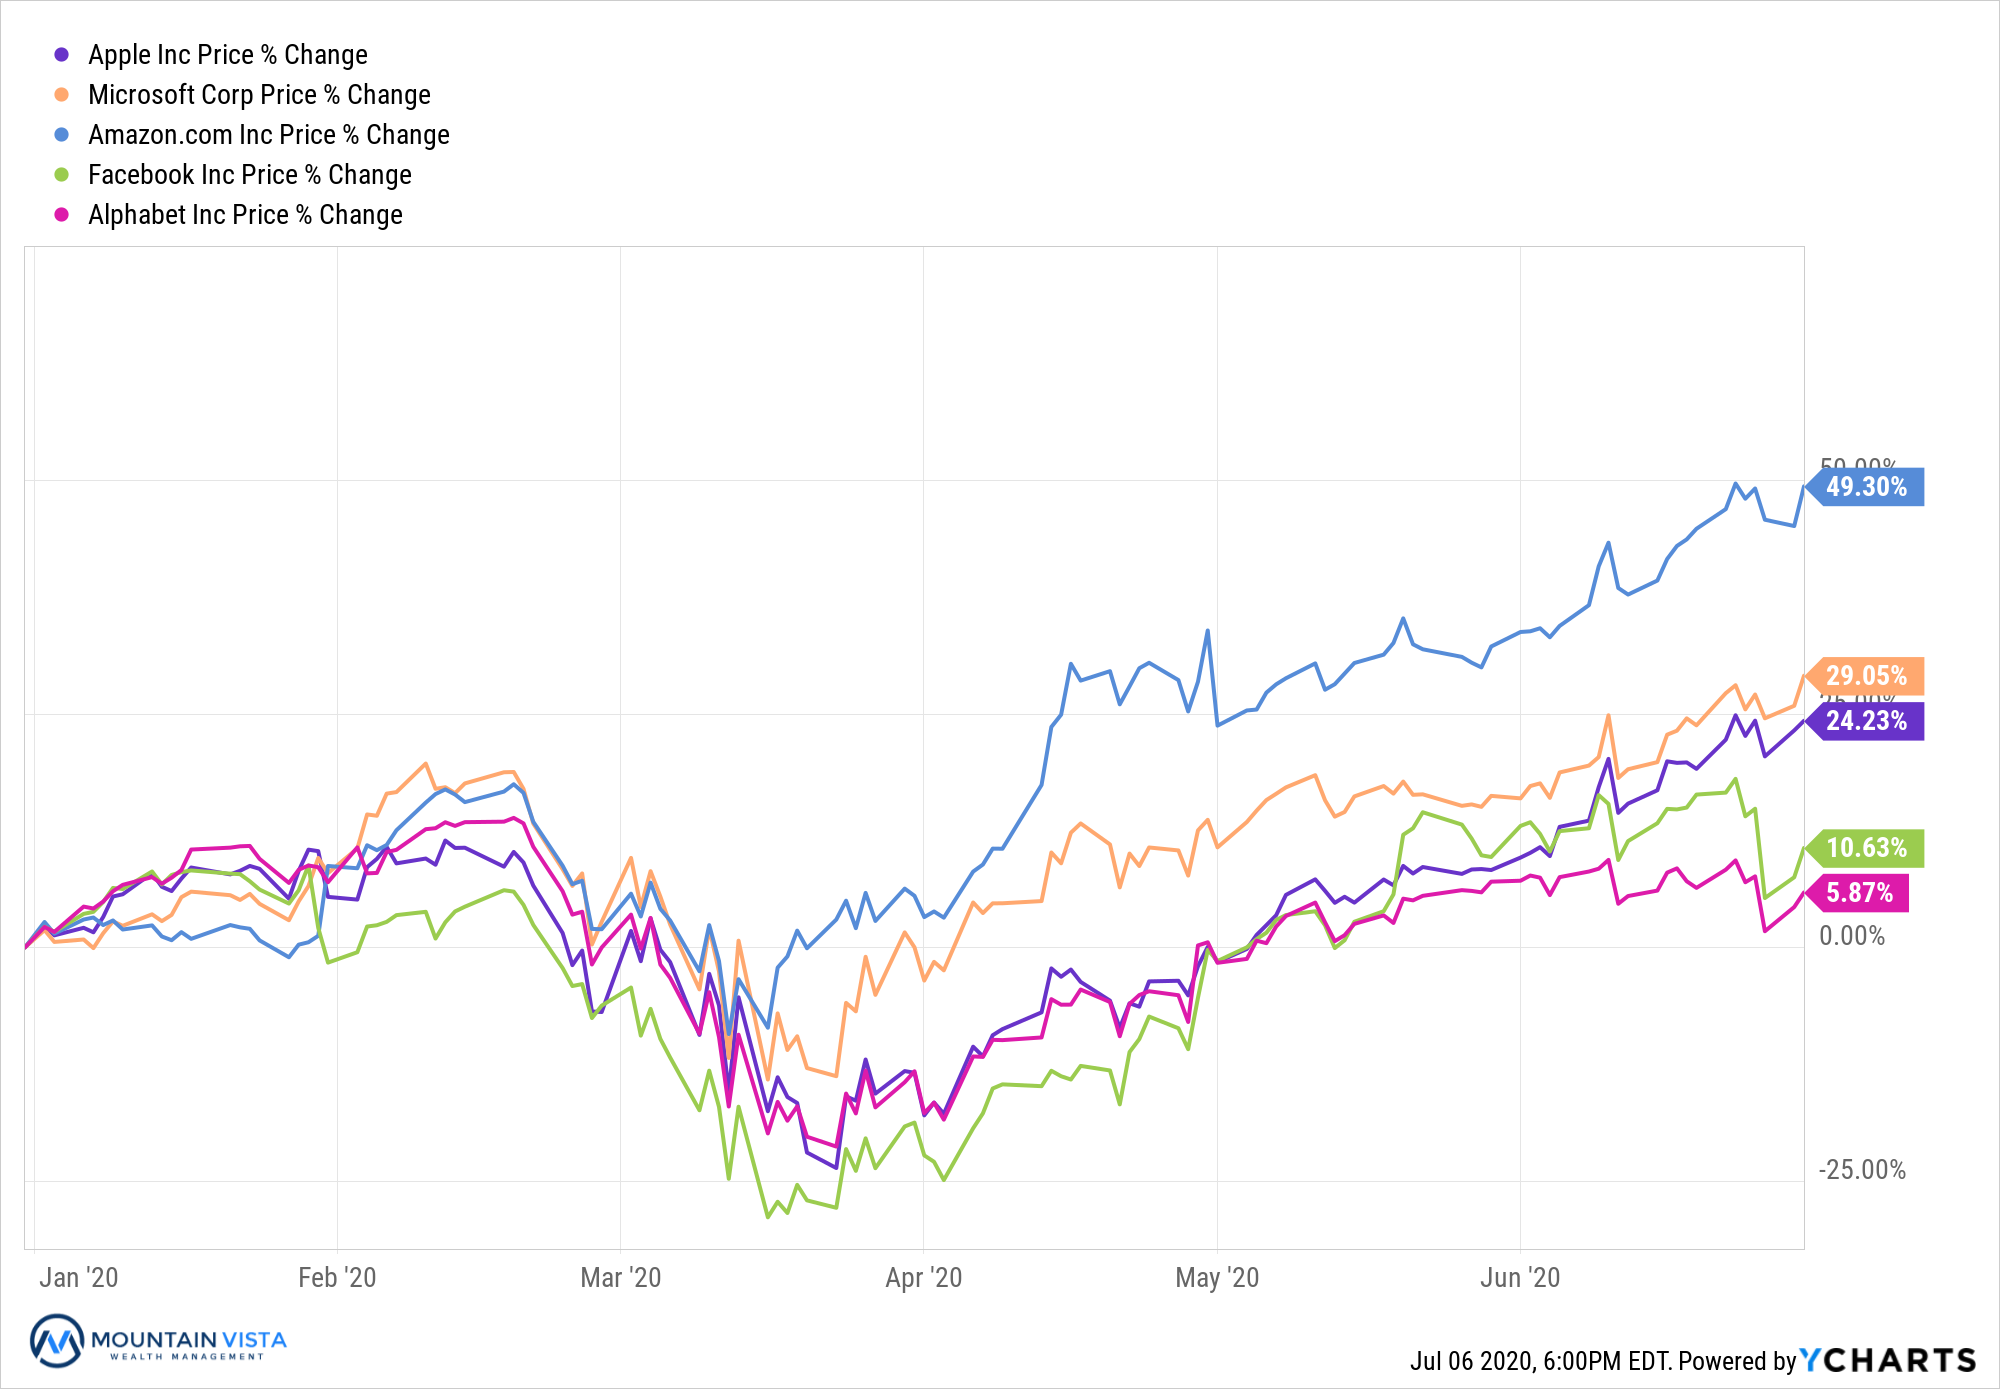
After becoming the first company to surpass $1 trillion in market capitalization in 2018, Apple’s market cap now exceeds $1.5 trillion at the end of the 2nd quarter. Microsoft is also worth $1.5 trillion and Amazon is a few trading days away from joining the club. One may have expected the law of large numbers to weigh on the performance of these stocks, but their businesses have largely benefited from a population under quarantine. Year-to-date these stocks are up 23-50%, and along with Facebook and Google, they represent over 20% of the S&P 500. The direction of these stocks will likely dictate the path forward for the broader market. At some point their returns must normalize, putting the onus on other sectors to drive returns.
Figure 3: Select Large Cap Tech Returns
EQUITY MARKET
Figure 4: Equity Index ETF Returns
| ETF | Description | Q2 2020 Total Return | 2020 Total Return |
| SPY | S&P 500 | 20.2% | (3.2%) |
| QQQ | Nasdaq 100 | 30.3% | 16.9% |
| IWM | Russell 2000 | 25.5% | (12.9%) |
| IVW | S&P 500 Growth | 26.0% | 7.7% |
| IVE | S&P 500 Value | 13.1% | (15.6%) |
| VXUS | International Ex-US | 17.8% | (11.0%) |
| IEMG | Emerging Markets | 18.7% | (10.6%) |
After suffering the fasted drop into a bear market in history, the recovery in prices experienced in the 2nd quarter has been almost as fast. Since bottoming on March 23rd, the SPY (S&P 500 ETF) has returned 39% and is only down (-3.2%) year-to-date. The recovery of the QQQ (Nasdaq 100 ETF) is even more impressive, returning 46% since the low and is up 17% year-to-date.
Small capitalization stocks outperformed large capitalization stocks in the 2nd quarter, but are still lower on a year-to-date basis. IWM (Russell 2000 ETF) returned 25.5% in Q2 2020, 5% more than SPY (S&P 500 ETF), but the year-to-date return of IWM is (-10%) lower.
IVW (S&P 500 Growth ETF) trounced IVE (S&P 500 Value ETF) in the 2nd quarter with a 26.0% return, resulting in an outperformance of 13%. IVW also outperformed during the sell-off in the 1st quarter, which brings the year-to-date outperformance to a mindboggling 23%. While relatively strong returns are somewhat justified, given IVW’s weighting towards the technology sector versus laggards like financials and energy, the valuation gap is at extreme levels. When the economy and daily activities slowly return to pre-COVID-19 patterns, we would expect the valuation gap to revert somewhat.
International and emerging market stock performance was roughly in-line with U.S. large cap equities. In the 2nd quarter, VXUS (International ETF) and IEMG (Emerging Market ETF) returned 17.8% and 18.7%, respectively. Both sectors are lower by approximately (-11%) year-to-date. If we start to see some weakness in the U.S. dollar, international and emerging market equities could shine.
At the beginning of the 2nd quarter, we were concerned that the market would retest the March 23rd lows. After seeing evidence that the virus was contained in early April, we shifted our equity weighting back to neutral. While the divergence between financial markets and the real economy is somewhat concerning, the unprecedented fiscal and monetary support has been the primary market driver.
Looking forward, we would expect weakness in the market brought on by a resurgence in COVID-19 cases to be met with further policy support. We also do not believe that a national level shutdown of the previous magnitude is likely. Additional fiscal policy actions, including stimulus checks and an extension of enhanced unemployment assistance, is likely to be passed in July, supporting those most in need. All of this means, we believe that the downside in the market is likely limited.
As we get closer to the election, concerns of higher corporate tax rates could start to weigh on markets, but that risk should be somewhat offset by friendlier trade policy with our international counterparts and more predictable policy and rhetoric out of the executive branch. Finally, it should be noted that markets have come back a long way, with the S&P 500 down only (-3%) year-to-date on a total return basis, while earnings have fallen dramatically. FactSet expects that S&P 500 companies are expected to report a (-43.9%) decline in 2nd quarter earnings and a (-21.6%) decline for fiscal year 2020.
Taking all of this into account, this leaves us tactically neutral equities, looking to rotate into cyclical sectors in anticipation of a resolution of COVID-19 and looking to add to equities on any material weakness.
Figure 5: Equity Sector Returns
| ETF | Description | Q2 2020 Total Return | 2020 Total Return | |
| XLE | Energy | 31.9% | (34.7%) | |
| XLY | Consumer Disc | 30.5% | 2.6% | |
| XLK | Technology | 30.4% | 14.9% | |
| XLB | Materials | 25.8% | (7.1%) | |
| XLI | Industrials | 16.9% | (14.6%) | |
| XLV | Healthcare | 13.4% | (0.9%) | |
| XLF | Financials | 11.9% | (23.7%) | |
| IYZ | Telecom | 11.5% | (6.4%) | |
| XLP | Consumer Staples | 8.5% | (5.6%) | |
| XLU | Utilities | 2.7% | (11.1%) |
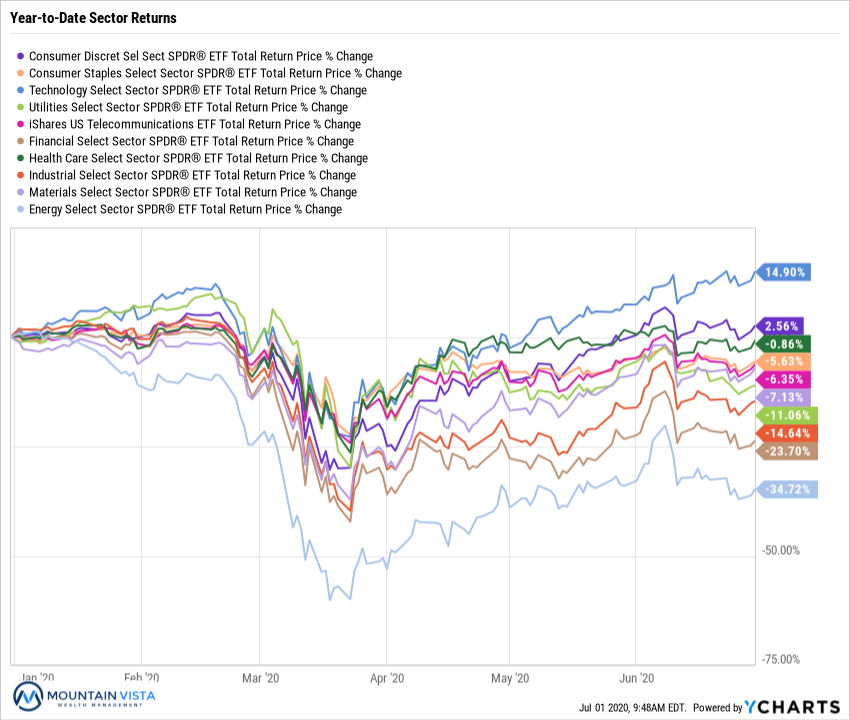
With equities in recovery mode, higher beta and cyclically sensitive stocks led defensive sectors in the 2nd quarter. XLE (Energy Sector ETF), XLY (Consumer Discretionary Sector ETF) and XLK (Technology Sector ETF) were the top performers, with returns ranging from 30 to 32%. At the end of the quarter, XLK and XLY are the only two sectors to be positive year-to-date, with XLK higher by an impressive 14.9%.
XLU (Utilities Sector ETF) and XLP (Consumer Staples Sector ETF) were the worst performing sectors with total returns of 2.7% and 8.5%, respectively. XLU and XLP both performed relatively well during the 1st quarter, so their weaker gains are not surprising.
Year-to-Date, XLE (Energy Sector ETF) and XLF (Financial Sector ETF) are major laggards, down (-34.7%) and (-23.7%), respectively.
During the 2st quarter, we were generally overweight technology and consumer discretionary, subject to suitability. We held a short-term position in financials to take advantage of the rotation that occurred in May and continue to look for opportunities to rotate into lagging sectors.
Figure 6: Equity Sector Year-to-Date Total Return
FIXED INCOME MARKET
Figure 7: Fixed Income Returns
| ETF | Description | Q2 2020 Total Return | 2020 Total Return | |
| AGG | Aggregate Bond | 3.1% | 6.3% | |
| BND | Total Bond Market | 4.1% | 6.4% | |
| LQD | IG Corporate | 9.7% | 6.4% | |
| JNK | HY Corporate | 8.4% | (5.4%) | |
| EMB | $ EM Bonds | 14.2% | (2.9%) | |
| SHY | 1-3 Yr Treasuries | 0.2% | 2.9% | |
| IEF | 7-10 Yr Treasuries | 0.6% | 11.2% | |
| TLT | 20+ Yr Treasuries | (0.2%) | 21.9% | |
| TIP | TIPs | 4.7% | 6.0% |
In the 2nd quarter, fixed income credit generated strong returns as spreads tightened and liquidity returned to those markets. The turnaround was sparked by the Federal Reserve’s announcement that they would purchase recently downgraded junk bonds, bond ETFs and would even lend directly to investment grade companies. U.S. Treasuries produced benign returns, as yields were generally stable throughout the quarter.
Amongst U.S. fixed income sectors, LQD (IG Corporate Bond ETF) and JNK (HY Corporate bond ETF) returned 9.7% and 8.4% in the 2nd quarter. JNK is down (-5.4%) year-to-date, while LQD returned 6.4%. U.S. Treasuries returned approximately 0% across the maturity spectrum and TIP (U.S. Treasury Inflation Protected Securities) returned 4.7%, as inflation expectations increased over the quarter.
EMB (Emerging Market Dollar Bond ETF) was the top performer overall, returning 14.2% in the 2nd quarter. EM bonds benefited from the recovery in oil prices, a weaker dollar and the general “risk-on” environment. Further weakness in the U.S. dollar would be supportive of future returns.
We continue to prefer holding higher levels of cash and being underweight fixed income.
Figure 8: U.S. Treasury Yields
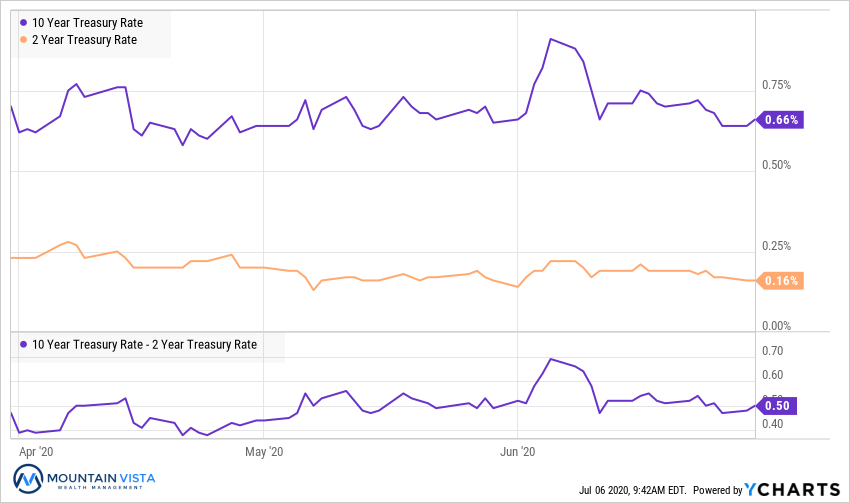
Treasury yields were rangebound, following their precipitous drop in the 1st quarter. The 10-year U.S. Treasury yield ended Q2 2020 at 0.66%, 4 bps lower than where it stood at the end of the 1st quarter. The spread between 2-year and 10-year treasury yields increased 3 bps to 50 bps.
Economists are increasingly expecting the Federal Reserve to implement yield curve control this Fall. This policy would utilize bond purchases to cap the yield levels at specific maturities of U.S. Treasuries. Yields typically increase during periods of higher economic growth and inflation, which has the effect of partially offsetting the growth of the economy. Holding yields down would make it cheaper to borrow and incentivize investors to move into riskier securities in search of a return greater than inflation.
Figure 9: U.S. Corporate Credit Spreads
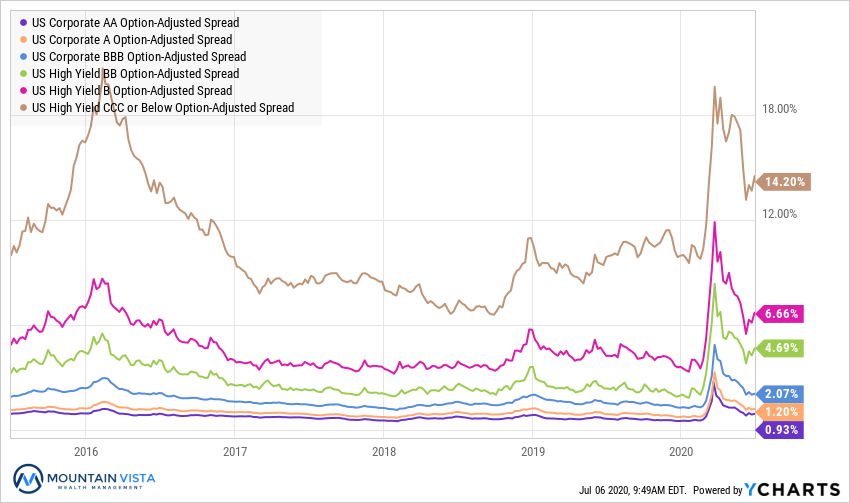
Corporate credit spreads tightened markedly over the course of the 2nd quarter, fueled by a combination of central bank liquidity and optimism that the worst of COVID-19’s impact on the economy was behind us. Spreads started to leak wider towards the end of the quarter, as the market took note of the increase in new COVID-19 cases and fears of a second wave grew.
CCC-rated bond spreads tightened by 374 bps over the 2nd quarter, retracing nearly 50% of the widening experienced from late February to the end of the 1st quarter. AA-rated bonds tightened by 89 bps to 93 bps. While investment grade bonds have widened a few basis points into the end of the quarter, their credit spreads have been resilient. This shows that the market expects some credit events in lower rated bonds, but suggests that there is no major systemic problem.
We will be watching CCC spreads closely as an indicator of the economy’s health and as a signal of more problems to come. It is normal to see some retracement after a large move tighter, but a prolonged move wider could be an indication of something more nefarious.
CONCLUSION
At Mountain Vista, we employ a tactical asset allocation framework in the management of our portfolios. Unlike passive managers, this affords us the flexibility to overweight or underweight each asset class (Equity, Fixed Income, Commodity, Cash) relative to each client’s target asset allocation. We do so based upon our view of each asset class’ risk and reward profile. This framework has served us well over the course of 2020. We raised cash levels significantly before the worst of the market route, limiting drawdowns in portfolios, and subsequently increased equity exposure at lower prices, allowing portfolios to benefit from the recovery.
Truly passive investment strategies that adhere to a rigid asset allocation do not have the flexibility to reflect market pricing in their portfolios and rely only on rebalancing to harvest gains of expensive asset classes. This leaves them exposed to corrections in overvalued asset classes and few strategies to limit drawdowns during a correction. Furthermore, passive strategies rely almost exclusively on their fixed income allocation to cushion corrections in the equity market. With U.S. Treasury yields close to zero, fixed income is not likely to provide as much shock absorption during equity corrections going forward.
To earn attractive long-term returns, an investor must remain invested during market downturns. By first, constructing portfolios that are suitable to our clients’ risk tolerance and time horizon and second, employing our tactical asset allocation framework, we are able to keep our clients invested and improve the probability that they achieve attractive long-term returns.
Thank you to our clients for your support of Mountain Vista. The current market environment is changing quickly and we will continue to work tirelessly and try to stay one step ahead. Please stay safe and healthy.
Sincerely,

Jonathan R. Heagle, CFA
President and CIO
Disclaimer
The views and opinions expressed are for informational and educational purposes only as of the date of writing and may change at any time based on market or other conditions and may not come to pass. This material is not intended to be relied upon as investment advice or recommendations, does not constitute a solicitation to buy or sell securities and should not be considered specific legal, investment or tax advice. The information provided does not take into account the specific objectives, financial situation, or particular needs of any specific person. All investments carry a certain degree of risk and there is no assurance that an investment will provide positive performance over any period of time. Equity investments are subject to market risk or the risk that stocks will decline in response to such factors as adverse company news or industry developments or a general economic decline. Debt or fixed income securities are subject to market risk, credit risk, interest rate risk, call risk, tax risk, political and economic risk, and income risk. As interest rates rise, bond prices fall. Non-investment-grade bonds involve heightened credit risk, liquidity risk, and potential for default. Foreign investing involves additional risks, including currency fluctuation, political and economic instability, lack of liquidity and differing legal and accounting standards. These risks are magnified in emerging markets. Past performance is no guarantee of future results.