
INTRODUCTION
“It makes no sense for individual investors to jump in and out of the market. People who trade in that way rarely die rich, whereas the patient investor often does.” – Philip Carret
Human beings’ “fight-or-flight” response was the result of an evolutionary process taking place during a very different time. It was effective at keeping primitive man or woman safe in the face of a predator, but it makes the average person a bad investor. While everyone understands that buying low and selling high is important to achieving investment success, too many do just the opposite in practice. Fear causes us to sell when prices are depressed and greed encourages us to chase securities that have recently performed very well.
The year 2020 has been challenging for a variety of reasons, and markets tested our resolve once again. After suffering its quickest move into bear market territory in March, the S&P 500 went on to have its best 5-month return, for the period ending August 31st, since 1938. At the stock market’s nadir, few would have expected it to recover so quickly. In fact, many expected things to get much worse. When fear takes hold, it is hard to remain focused on the long term, but 2020 reminded us, once again, that selling out of fear and at depressed levels is rarely the best decision.
Fast forward to today, the market’s psychology and valuation have changed dramatically. A euphoric move higher in August brought a level of speculation we have not witnessed in quite some time. We took that opportunity to raise cash levels to the highest levels since March. Just as you should not sell out of fear, you should not buy just because prices have moved higher.
With the upcoming election in November, many of our clients are concerned about a contested election and fear a replay of the technology bubble. While we expect the market to remain volatile for the short-term, and prices could certainly head lower temporarily, we believe that equities will be the best vehicle to grow wealth over the medium to long term.
Thank you to all of our clients for your continued support.
Sincerely,

Jonathan R. Heagle
President and Chief Investment Officer
OVERALL MARKET COMMENTARY
The rebound in equity market, which was fueled by unprecedented fiscal and monetary stimulus in March, continued in the 3rd quarter. At the end of August, QQQ (Nasdaq 100 ETF) was up 30.6% year-to-date and 19.1% in the July and August alone. Signs of speculative excess were abundant, namely a surge in short expiration call buying, price increases on announced stock splits (e.g. Tesla & Apple), parabolic moves higher after the earnings release of high growth companies (e.g. Salesforce.com, Zoom & DocuSign) and QQQ (Nasdaq 100 ETF) was 26.2% above its 200-day moving average. Many market commentators were drawing comparisons to the technology bubble of the late ‘90s.
Luckily, sanity returned in September with S&P 500 and Nasdaq 100 falling near (-10%) and (-13%), respectively. While no one likes to see declines in their portfolio, equity prices had outrun their fundamentals and were overdue for a refresh. Corrections are healthy, reducing excess speculation and providing a stronger foundation for further gains.
This correction was initially driven by profit taking in the year’s biggest winners, such as popular technology stocks and stay-at-home winners. Sentiment then weakened more broadly as the next round of fiscal stimulus proved to be too political to pass in advance of the Presidential election. Finally, with less than two months to go before what is likely to be a heated election season, many decided it was time to take some chips off of the table.
Thoughts on the Election
Many of our clients are concerned about the impact of the election on the value of their portfolio. While the potential for short-term volatility cannot be ruled out, history suggests that the performance of the stock market is largely indifferent to which party controls the executive office. As you can see in the graphic below, since 1789, returns averaged 8.8% under a Democrat and 8.6% under a Republican.
Figure 1: Index Returns by Party President
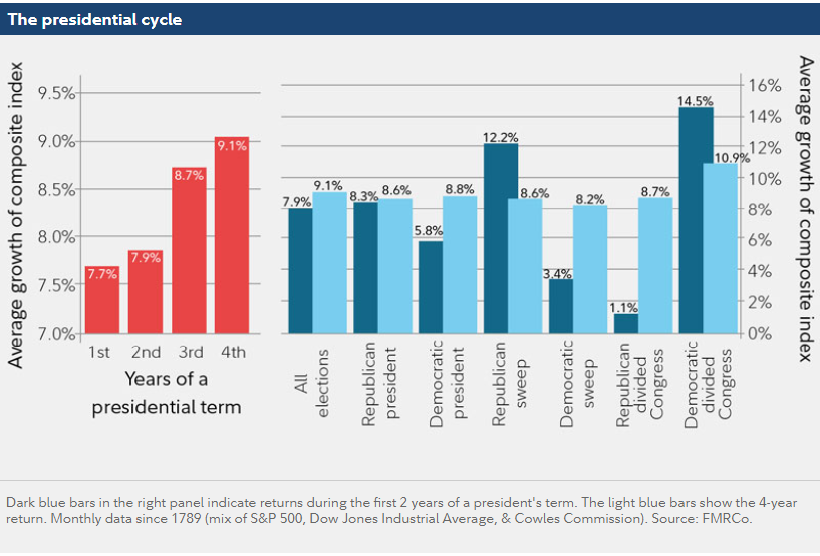
Rather than making big moves in your portfolio, which would no doubt be influenced by your own personal political biases, focus on the fact that stocks have produced fantastic returns under the leadership of both political parties. Furthermore, events that cause major disruptions to markets are typically unexpected. Everyone knows there is an election coming, so the passing of the event is more likely to reduce uncertainty than cause disruption.
Back in 2016, it was generally believed that a Trump victory would cause the stock market to plummet. It did for a few hours the night of the election, but then the S&P 500 took off and never looked back, returning 21.8% in 2017 with minimal volatility. Today, there are concerns that a victory by the former Vice President would mean business unfriendly policy and higher taxes. While taxes increases would likely occur, they would probably be targeted at high earners, who are more likely to save that marginal dollar rather than spend it, and corporations that are arguably exploiting the current tax code. A Biden administration would almost certainly increase fiscal spending, which would offset the drag caused by higher taxes.
The bottom line is that a Trump or Biden victory is more likely to cause winners or losers at the company and sector level than to materially impact the medium-term direction of the overall market. While we raised cash in anticipation of election uncertainty, it was done tactically and we will look for opportunities to buy as the election nears.
EQUITY MARKET
Figure 2: Equity Index ETF Returns
| ETF | Description | Q3 2020 Total Return | 2020 Total Return |
| SPY | S&P 500 | 9.0% | 5.5% |
| QQQ | Nasdaq 100 | 12.4% | 31.4% |
| IWM | Russell 2000 | 5.0% | (8.6%) |
| IVW | S&P 500 Growth | 11.6% | 20.3% |
| IVE | S&P 500 Value | 4.7% | (11.6%) |
| VXUS | International Ex-US | 6.8% | (5.0%) |
| IEMG | Emerging Markets | 10.9% | (0.9%) |
In the 3rd quarter, equity markets continued their positive momentum from the previous quarter. In July, SPY (S&P 500 ETF) turned positive for the year, recovering all of the losses suffered during the 1st quarter. Prices declined in September, but the gains of the prior two months resulted in quarterly total returns for SPY (S&P 500 ETF) and QQQ (Nasdaq 100 ETF) of 9.0% and 12.4%, respectively.
Small capitalization stocks lagged large capitalization stocks in the 3nd quarter and are still negative on a year-to-date basis. IWM (Russell 2000 ETF) returned 5.0% in Q3 2020, (-4.0%) lower than SPY (S&P 500 ETF). IWM is still down (-8.6%) year-to-date. The underperformance was driven by the failure of a new fiscal stimulus package, signs of slowing growth and the resurgence of COVID-19 cases in various parts of the world.
Despite a meaningful correction during September, IVW (S&P 500 Growth ETF) handily outperformed IVE (S&P 500 Value ETF) in the 3nd quarter with an 11.6% return, resulting in an outperformance of 6.9%. Year-to-date, IVW has outperformed IVE by a mindboggling 31.9%. Despite the major underperformance of the indices, there have been individual companies that have benefited from a “rotation” from high growth technology stocks to economic recovery plays.
International equities slightly underperformed U.S. large caps, while emerging market equities slight outperformed. In the 3nd quarter, VXUS (International ETF) and IEMG (Emerging Market ETF) returned 6.8% and 10.9%, respectively. Both sectors remain in negative territory on a year-to-date basis. Further declines in the U.S. dollar would be supportive of Emerging Market stocks, in particular.
In August, we moved portfolios to an underweight position in equities. This was a result of extremely bullish sentiment and valuation, coupled with the proximity of the election. Despite this move, we still believe that equities are the only game in town and remain the best place to be invested over the medium term. While the outcome of the election could cause volatility in the short term, we believe it is unlikely to have a material impact on the overall market over the medium term. For these reasons, we will look for opportunities to bring portfolios back to a neutral weight in the coming weeks and months.
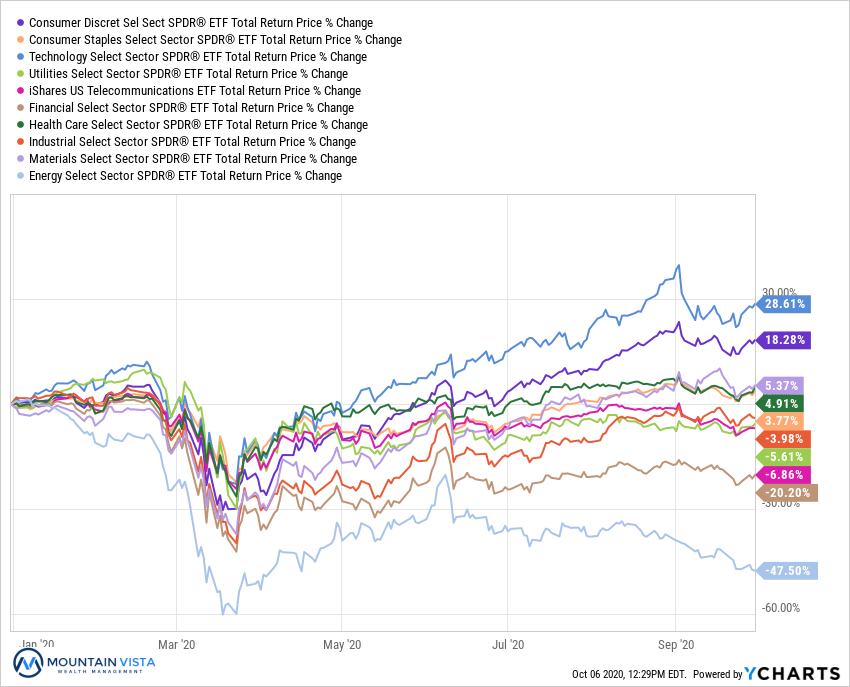
Figure 3: Equity Sector Returns
| ETF | Description | Q3 2020 Total Return | 2020 Total Return |
| XLY | Consumer Disc | 15.3% | 18.3% |
| XLB | Materials | 13.5% | 5.4% |
| XLI | Industrials | 12.5% | (4.0%) |
| XLK | Technology | 11.9% | 28.6% |
| XLP | Consumer Staples | 10.0% | 3.8% |
| XLU | Utilities | 6.1% | (5.6%) |
| XLV | Healthcare | 5.8% | 4.9% |
| XLF | Financials | 4.6% | (20.2%) |
| IYZ | Telecom | (0.5%) | (6.9%) |
| XLE | Energy | (19.6%) | (47.5%) |
In the 3rd quarter, the composition of sector returns was more nuanced than usual, with mixed results amongst defensive and cyclical sectors. Five sectors produced double-digit returns in the quarter, with XLY (Consumer Discretionary Sector ETF) and XLB (Materials Sector ETF) leading the pack with total returns of 15.3% and 13.5%, respectively.
XLE (Energy Sector ETF) and IYZ (Telecom Sector ETF) were the laggards, experiencing negative returns over the quarter. XLE was down a whopping (-19.6%) after being the top sector in the 2nd quarter. XLE’s performance was even more concerning given the improving economy and weakening U.S. dollar. As the economy continues to move towards sustainable and renewable energy sources, many have given up on investing in Oil and Gas companies.
Despite the dimmed prospects for a fiscal package in front of a highly contentious election and Supreme Court nomination, we still believe that the financial sector is attractive. It stands to benefit from a resurgence in economic activity and increases in long-term interest rates. Also, a surprise agreement on a fiscal package would give the sector a boost. XLF is still down (-20.2%) year-to-date.
As a hedge to a resurgence of COVID-19 this fall, we continue to like overweight positions in technology and consumer discretionary.
Figure 4: Equity Sector Year-to-Date Total Return
FIXED INCOME MARKET
Figure 5: Fixed Income Returns
| ETF | Description | Q3 2020 Total Return | 2020 Total Return |
| AGG | Aggregate Bond | 0.4% | 6.7% |
| BND | Total Bond Market | 0.4% | 6.9% |
| LQD | IG Corporate | 0.8% | 7.3% |
| JNK | HY Corporate | 4.5% | (1.2%) |
| EMB | $ EM Bonds | 2.4% | (0.5%) |
| SHY | 1-3 Yr Treasuries | 0.1% | 3.0% |
| IEF | 7-10 Yr Treasuries | 0.2% | 11.4% |
| TLT | 20+ Yr Treasuries | (0.1%) | 21.8% |
| TIP | TIPs | 2.8% | 9.1% |
In the 3nd quarter, fixed income credit was again the top performer. Credit benefited from marginal spread tightening and higher yields than other fixed income sectors. U.S. Treasuries produced benign returns, as yields were generally stable throughout the quarter.
Amongst U.S. fixed income sectors, JNK (HY Corporate Bond ETF) and TIP (U.S. TIPs ETF) returned 4.5% and 2.8% in the 3rd quarter. JNK is still down (-1.2%) year-to-date. After strong gains in the 2nd quarter, LQD (IG Corporate Bond ETF) only returned 0.8% in the 3rd quarter.
EMB (Emerging Market Dollar Bond ETF) returned 2.4% in the quarter. Emerging markets were supported by a weaker dollar and while Oil and Gas stocks were weak, the price of oil was relatively stable.
We continue to prefer holding higher levels of cash and being underweight fixed income. That being said, fixed income remains an important source of income and stability to portfolios.
Figure 6: U.S. Treasury Yields
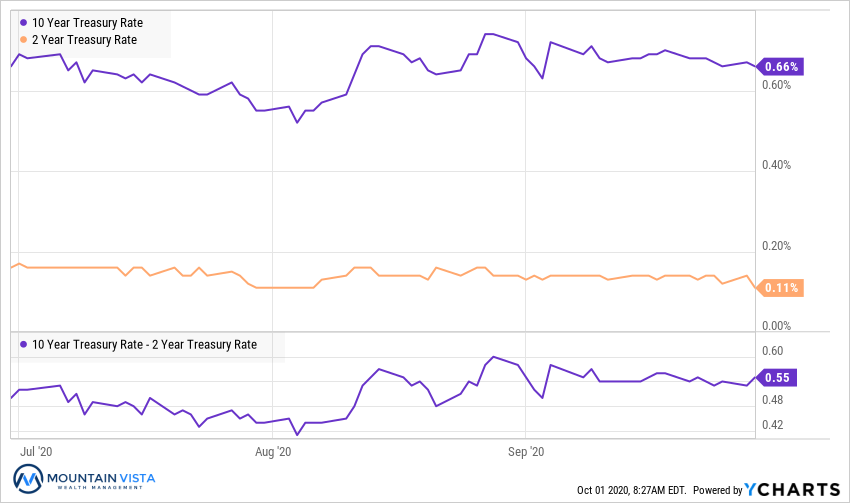
Treasury yields remained rangebound in the 3rd quarter. The 10-year U.S. Treasury yield ended Q3 2020 at 0.66%, right where it started. The spread between 2-year and 10-year treasury yields increased 5 bps to 55 bps, because of a drop in the 2-year yield.
In September, the Federal Reserve altered it’s messaging around their willingness to accept higher levels of inflation in the future, in order to achieve full employment. While this change would generally be viewed as bullish for inflation expectations and future growth prospects, they announced few details on how the implementation of this change in perspective would translate to policy. Furthermore, it became clear that not all Fed governors were aligned on how to achieve this goal. While the markets were clearly disappointed in the outcome, we expect the Federal Reserve to remain very accommodative, making equities the important game in town for the foreseeable future.
Figure 7: U.S. Corporate Credit Spreads
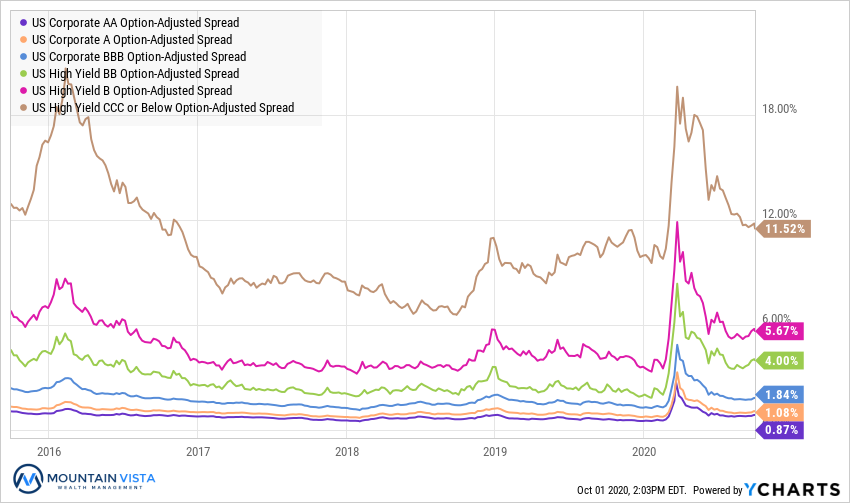
Corporate credit spreads continued to tighten over the course of the 3rd quarter. Central bank liquidity and a steady improvement in the economy were supportive of credit. Spreads started to leak wider towards the end of the quarter, as the market took note of the increase in new COVID-19 cases and fears of a second wave grew.
CCC-rated bond spreads tightened by 258 bps over the 3rd quarter and are only ~150 bps wider than where they ended 2019. AA-rated bonds tightened by 6 bps to 87 bps. While investment grade bonds have widened a few basis points into the end of the quarter, their credit spreads have been resilient.
Credit spreads have been very well behaved during the volatility in equity market during September. This reinforces our view that the sell-off in equities is a healthy correction.
CONCLUSION
The year 2020 has been a wild ride so far, and to many, including me, it has felt like an eternity. With a heated election on the horizon, the final quarter is also likely to have its share of exciting moments. During these highly emotional and uncertain periods, it is important to remain calm, stick to your long-term plan and keep making good decisions on a daily basis. Eventually, your consistency and determination will be rewarded and sanity will prevail.
Whenever the stock market gets bumpy, I find it useful to remind myself that the market is just an aggregation of individual companies. For the most part, each of these companies is focused on creating and growing value at the organizational level. While equity prices can fluctuate based on a variety of factors, and the economy can suffer setbacks that foil the best laid plans, the path of least resistance for corporate valuations, and therefore equity prices, is higher.
Thank you to our clients for your support of Mountain Vista. The current market environment is changing quickly and we will continue to work tirelessly and try to stay one step ahead. Please stay safe and healthy.
Sincerely,
Jonathan R. Heagle, CFA
President and CIO
Disclaimer
The views and opinions expressed are for informational and educational purposes only as of the date of writing and may change at any time based on market or other conditions and may not come to pass. This material is not intended to be relied upon as investment advice or recommendations, does not constitute a solicitation to buy or sell securities and should not be considered specific legal, investment or tax advice. The information provided does not take into account the specific objectives, financial situation, or particular needs of any specific person. All investments carry a certain degree of risk and there is no assurance that an investment will provide positive performance over any period of time. Equity investments are subject to market risk or the risk that stocks will decline in response to such factors as adverse company news or industry developments or a general economic decline. Debt or fixed income securities are subject to market risk, credit risk, interest rate risk, call risk, tax risk, political and economic risk, and income risk. As interest rates rise, bond prices fall. Non-investment-grade bonds involve heightened credit risk, liquidity risk, and potential for default. Foreign investing involves additional risks, including currency fluctuation, political and economic instability, lack of liquidity and differing legal and accounting standards. These risks are magnified in emerging markets. Past performance is no guarantee of future results.