
INTRODUCTION
“It was the best of times, it was the worst of times, it was the age of wisdom, it was the age of foolishness, it was the epoch of belief, it was the epoch of incredulity, it was the season of light, it was the season of darkness, it was the spring of hope, it was the winter of despair.”
– Charles Dickens, A Tale of Two Cities
As the sun sets on 2020 and I reflect on the last twelve months, I am struck by the many contradictions in our financial, political and personal lives. Each individual’s views and experiences have been forced even wider apart over the last twelve months. Charles Dickens could have been writing about our world in the passage above, taken from his famous book.
I, like so many of you, cannot wait to turn the page on 2020. While it has been a great year for investing, I would quickly trade a few percentage points of returns, so that my daughters could hug their grandparents or see the Nutcracker in person this holiday season. However difficult the current environment might be, it’s important to remain focused on the positives and the promise of a brighter future.
Looking at 2021 and beyond, there are reasons to be optimistic! Numerous vaccines have been approved and are being distributed as we speak. Sectors that rely on in-person experiences should boom once people feel that public interactions are safe. Moreover, fiscal and monetary policy are working hand-in-hand to assist in weathering the final months of the economic fallout from the pandemic.
Regardless of what 2021 brings, one of my New Year’s resolutions is to be more empathetic to those experiencing “the worst of times” and be grateful for all of the positives in my life.
Mountain Vista experienced strong growth in 2020 thanks to our amazing clients. We deeply appreciate your confidence and will continue to work tirelessly to improve your financial future. Happy holidays!
Sincerely,

Jonathan R. Heagle
President and Chief Investment Officer
OVERALL MARKET COMMENTARY
The power of a harmonized fiscal and monetary policy response was on full display in 2020. The SPY (S&P 500 ETF) and QQQ (Nasdaq 100 ETF) finished the year with returns of 18.3% and 48.6%, respectively. This despite a raging global pandemic that created significant economic hardships across many segments of the economy. The returns are all the more remarkable when you consider that the two indices saw peak-to-trough declines of (-34%) and (-29%), respectively, in the 1st quarter.
In the 1st and 2nd quarters of 2020, quarter-over-quarter U.S. real GDP fell (-5.0%) and (-31.4%), respectively. During this time, it was hard to imagine a swift economic recovery taking place and many feared a repeat of the financial crisis and a much more serious drop in GDP than was actually realized. It was the quick and substantial response from Congress and the Federal Reserve that allowed markets and the economy to stabilize and then recover in short order.
In March, Congress passed the CARES Act, totaling $2.2 trillion, and the Federal Reserve quickly reduced interest rates, reinstated bond buying programs and announced a plethora of lending and liquidity facilities. These actions combined to supercharge the economy, resulting in quarter-over-quarter U.S. real GDP growth of 33.4% in the 3rd quarter. The S&P 500 bottomed on March 23rd and proceeded to return nearly 70% through the end of the year.
Former Chairman of the Federal Reserve, Ben Bernanke, blamed the Depression on overly tight monetary policy. His actions after the Financial Crisis erred on the side of easy policy, to create conditions for growth. Despite the aggressive actions that he took as Fed Chair, he never had much help from the Fiscal side. The result was a slow recovery that depended almost exclusively on monetary policy.
Hopefully, Congress has learned that fiscal stimulus is an effective tool for supporting the economy. With interest rates near zero, the Federal Reserve has fewer and fewer rabbits to pull out of its hat.
The Year that Technology Saved Us All
Throughout 2020, many of our daily routines were altered dramatically in an effort to contain the spread of COVID-19. We learned to utilize technology for shopping, healthcare and entertainment. It is truly remarkable how quickly we adapted our personal and professional lives to a “stay-at-home” model. I shudder at the thought of what COVID-19 would have done to our economy and lives if it occurred just 10 years ago.
In this tech-enabled world, it should come as no surprise that the companies that provide these services also saved our investment portfolios. Apple, Microsoft, Amazon, Facebook and Google account for over 20% of the S&P 500 and, on average, they produced over 50% returns in 2020. Away from the largest tech companies, the returns of “work-from-home” stocks were simply stunning. Consider ZOOM (+396%), DocuSign (+200%) and MercadoLibre (+193%).
As we enter 2021, there are reasons to be cautious on technology. As the economy reopens, life should normalize to some degree, making us less reliant on technology. Long-term interest rates should continue to move higher, as inflation and economic growth rebound, putting pressure on the nosebleed valuations the market is bestowing on these companies. Finally, the revenue growth experienced in 2020 will come down as year-over-year comparisons become more challenging.
Signs of Froth, SPACs and IPOs
There are many signs of excess in the stock market these days. One of the most notable is the booming new issue market and the eye-popping first day performance of high-profile IPOs. Seasoned investors cannot help but think back to the late 90s and the amazing gains posted by soon-to-be-bankrupt “dot com” companies. IPO, an ETF that invests in recently issued initial public offerings, returned 107% this year, more than doubling the return of the Nasdaq 100.
In addition to the standard IPO, we saw a significant uptick in the issuance of special purpose acquisition companies, or SPACs, and private companies being taken public by merging with a SPAC. Critics point to the uptick in SPAC issuance as a sign of excessive speculation.
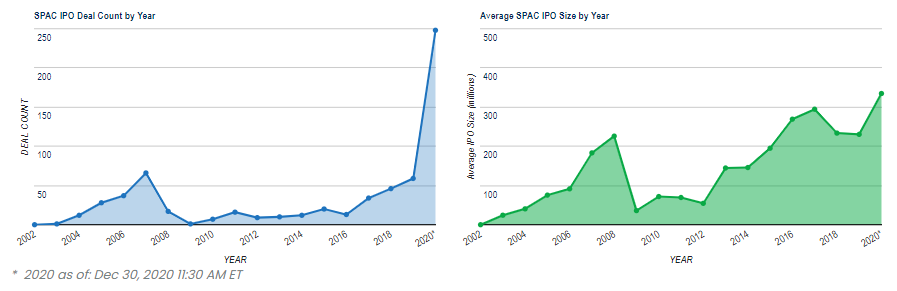
SPACs are generally issued by a prominent figurehead in the investing or business community. The investor in the SPAC is relying on the expertise of the sponsor to identify attractive acquisition targets. At the time the SPAC is issued, the investor generally has no idea what they are investing in. For the privilege of receiving this “blank check”, the sponsor receives 20% of the shares for a nominal fee.
SPACs are arguably a symptom of the massive amounts of stimulus that has been pumped into the market. There is too much money chasing too few opportunities. SPAC issuance helps absorb some of that excess liquidity in the system. While the early SPACs should be able to locate strong investments, the landscape will get more competitive as the quality of available investment deteriorates. The issuance of SPACs will likely continue until something breaks.
EQUITY MARKET
Figure 2: Equity Index ETF Returns
| ETF | Description | Q4 2020 Total Return | 2020 Total Return |
| SPY | S&P 500 | 12.1% | 18.3% |
| QQQ | Nasdaq 100 | 13.1% | 48.6% |
| IWM | Russell 2000 | 31.3% | 20.0% |
| IVW | S&P 500 Growth | 10.7% | 33.2% |
| IVE | S&P 500 Value | 14.6% | 1.2% |
| VXUS | International Ex-US | 16.5% | 10.7% |
| IEMG | Emerging Markets | 18.9% | 17.9% |
2020 went out with a bang, with strong gains in the 4th quarter. SPY (S&P 500 ETF) returned 12.1% in the quarter and closed the year with an 18.3% total return. QQQ (Nasdaq 100 ETF) returned 13.1% in the 4th quarter, adding to its outperformance over SPY and totaling an impressive 48.6% return year-to-date.
Small capitalization stocks were in overdrive during the 4th quarter, more than erasing their deficit versus large capitalization stocks. IWM (Russell 2000 ETF) returned 31.3% in Q4 2020, outperforming SPY (S&P 500 ETF) by 19.2% in the quarter and by 1.7% year-to-date. This strong performance was a result of the approval of multiple COVID-19 vaccines, progress towards an additional fiscal stimulus package and optimism about growth in 2021.
IVE (S&P 500 Value ETF) outperformed IVW (S&P 500 Growth ETF) in the 4th quarter with a 14.6% return, resulting in an outperformance of 3.8%. Despite IVE’s outperformance in the quarter, IVW has outperformed IVE by a mindboggling 32.0% year-to-date. The IVE’s strong returns in the 4th quarter were driven by a continuation of the rotation into cyclical and COVID recovery stocks, as the market anticipates a return to normal in 2021.
International and emerging market equities outperformed U.S. large caps as the dollar weakened, oil rebounded and the technology sector was less dominant. In the 4th quarter, VXUS (International ETF) and IEMG (Emerging Market ETF) returned 16.5% and 18.9%, respectively. Both VXUS and IEMG are back to levels last seen in 2018. 2021 could be a breakout year for international stocks if the weakening trend in the dollar continues.
During the quarter we brought equities back to a neutral weight as the uncertainties facing the market were resolved. We are expecting further gains in 2021, but would not be surprised to see a correction at some point in the 1st quarter. We will likely view any dip as a buying opportunity.
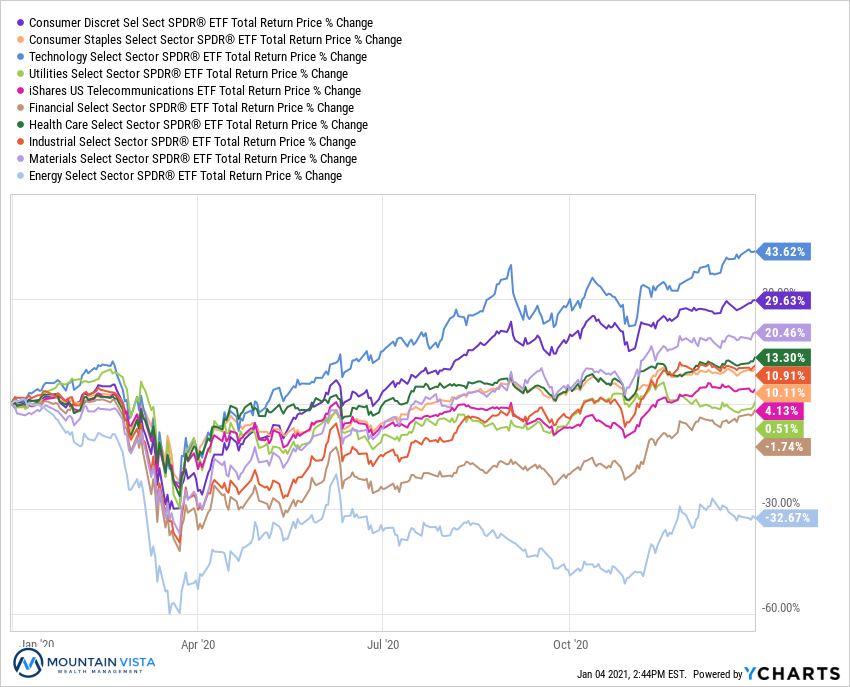
Figure 3: Equity Sector Returns
| ETF | Description | Q4 2020 Total Return | 2020 Total Return |
| XLE | Energy | 28.2% | (32.7%) |
| XLF | Financials | 23.1% | (1.7%) |
| XLI | Industrials | 15.5% | 10.9% |
| XLB | Materials | 14.3% | 20.5% |
| IYZ | Telecom | 11.8% | 4.1% |
| XLK | Technology | 11.7% | 43.6% |
| XLY | Consumer Disc | 9.6% | 29.6% |
| XLV | Healthcare | 8.0% | 13.3% |
| XLU | Utilities | 6.5% | 0.5% |
| XLP | Consumer Staples | 6.1% | 10.1% |
XLP (Consumer Staples Sector ETF) and XLU (Utilities Sector ETF) were the laggards in the 4th quarter, posting returns of 6.1% and 6.5%, respectively. The increase in long term yields weighed on these sectors.
In the 4th quarter, cyclical sectors led the gains, as optimism surrounding the roll-out of COVID-19 vaccinations allowed investors to see the proverbial light at the end of the tunnel. XLE (Energy Sector ETF) and XLF (Financial Sector ETF) were the top performing sectors with 4th quarter returns of 28.2% and 23.1%, respectively. They are also the only two sectors to close in negative territory year-to-date. Despite posting a market return for the quarter, 2020 was the year of technology, with XLK (Technology Sector ETF) returning a whopping 43.6%.
As we look forward to 2021, we continue to prefer a tilt towards cyclical sectors, such as financials and industrials. We expect growth to be very robust as the economy opens and would expect an upward bias on inflation. While we are tactically concerned about valuations in pockets of the technology sector in the near-term, we want to be overweight technology on a medium/long-term basis.
Figure 4: Equity Sector Year-to-Date Total Return
FIXED INCOME MARKET
Figure 5: Fixed Income Returns
| ETF | Description | Q4 2020 Total Return | 2020 Total Return |
| AGG | Aggregate Bond | 0.7% | 7.5% |
| BND | Total Bond Market | 0.8% | 7.7% |
| LQD | IG Corporate | 3.4% | 11.0% |
| JNK | HY Corporate | 6.2% | 4.9% |
| EMB | $ EM Bonds | 6.0% | 5.4% |
| SHY | 1-3 Yr Treasuries | 0.0% | 3.0% |
| IEF | 7-10 Yr Treasuries | (1.3%) | 10.0% |
| TLT | 20+ Yr Treasuries | (3.0%) | 18.2% |
| TIP | TIPs | 1.6% | 10.8% |
In the 4th quarter, high yield and emerging market bonds outperformed. Corporate credit benefited from both spread tightening and higher relative yields. U.S. Treasuries experienced losses, as longer dated yields increased over the quarter.
Amongst U.S. fixed income sectors, JNK (HY Corporate Bond ETF) was the top performer in the 4th quarter, returning 6.2%. TLT (20+ Yr U.S. Treasury ETF) returned 18.2% for the full year, benefiting from the collapse of long-term interest rates.
EMB (Emerging Market Dollar Bond ETF) returned 6.0% in the quarter and 5.4% year-to-date. Emerging markets were supported by a weaker dollar and a recovery of the oil & gas sector.
Looking forward, we must temper our return expectations from fixed income. Unless we see negative interest rates and/or a deflationary environment, fixed income’s main feature is to provide stability and diversification from our equity portfolio. We remain underweight fixed income in favor of cash.
Figure 6: U.S. Treasury Yields
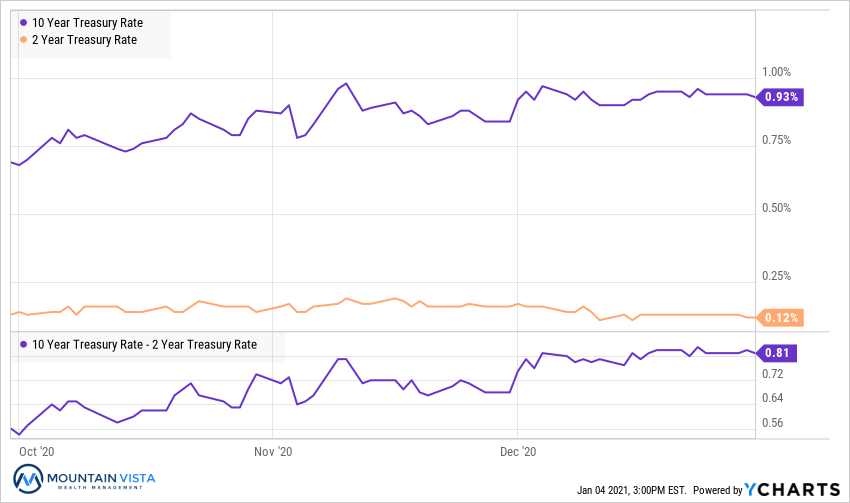
The treasury curve steepened materially in the 4th quarter. 10-year U.S. Treasury yields increased 24 bps, while the 2-year U.S. Treasury yield fell 1 bp. This resulted in a 25 bp increase in the spread between 2’s and 10’s. The steepening of the curve was a major driver of financial sector outperformance in the quarter.
With the approval of the COVID-19 vaccine, continued fiscal stimulus and an accommodative Federal Reserve, growth expectations for 2021 picked up meaningfully, which resulted in an increase in long-term yields. Morgan Stanley forecasts U.S. Real GDP growth of 5.9% in 2021, much higher than the consensus of 3.8%. With such strong economic growth and the prospect of higher inflation, the opportunity cost of holding long-dated fixed income has increased materially.
Figure 7: U.S. Corporate Credit Spreads
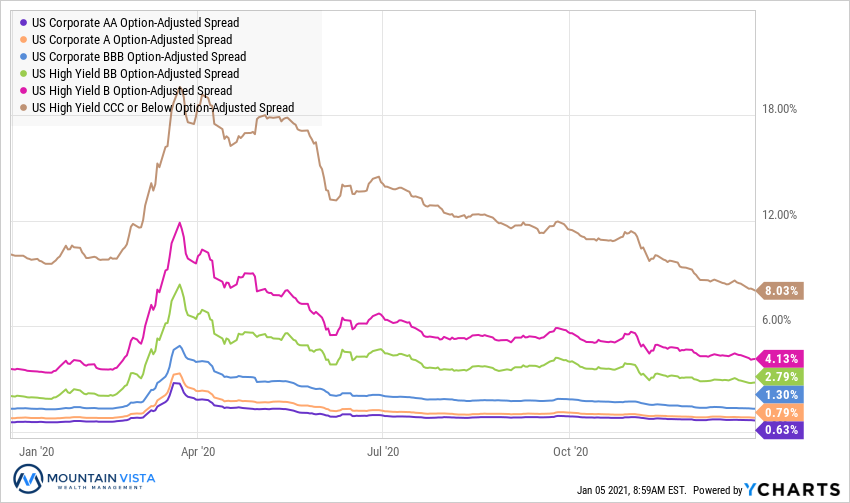
Corporate credit spreads continued to tighten over the course of the 4th quarter. Central bank liquidity, a steady improvement in the economy and expectations of a strong recovery in 2021 were supportive of credit. Other than the volatility around the election, the path has been a straight line down and to the right.
CCC-rated bond spreads tightened by a remarkable 349 bps over the 4rd quarter and are ~205 bps tighter than where they ended 2019. The drop in CCC-rated spreads versus last year makes sense when you consider that inflation and growth are expected to be so strong in 2021, but the magnitude is impressive. AA-rated bonds tightened by 24 bps to 63 bps and are roughly where they entered 2020.
The stability in credit spreads at the end of the 3rd quarter reinforced our view that the drop in the equity markets was a “healthy correction”. That view was confirmed with indices recovering to all-time highs. The credit markets are currently telling us to expect a strong economy heading into 2021.
CONCLUSION
Many of us are excited to turn the page on 2020 and desperately long for a return to “normal” in 2021. While I would also like to get back some of the freedoms lost in 2020, I prefer a slightly different mindset. Life is rarely black and white, but contains many shades of gray.
In times of despair, I try to focus on the positives in my life. For example, 2020 allowed many of us to spend much more time with our immediate families, rediscover the outdoors, learn how to bake bread or pick up a new hobby. Conversely, in a return to “normal” I do not expect all of my problems to disappear. It could mean a retreat from nature or our families, long hours in an office and the return of a daily commute.
This balanced mindset is not only healthy for my mental well-being, but I believe it makes me a better investor. Looking for opportunities when everyone else is running for the exit and looking for risks when markets are frothy. It helps me keep my clients invested and opportunistic throughout market cycles and have conviction in my views. Finally, it helped us manage our way through a very difficult market in 2020.
Thank you to our clients for your continued support of Mountain Vista. I wish everyone a healthy and prosperous 2021!
Sincerely,
Jonathan R. Heagle, CFA
President and CIO