
INTRODUCTION
“In investing, what is comfortable is rarely profitable.” -Robert Arnott
The year 2022 was challenging for any investor utilizing traditional investments to construct their portfolio. With the Federal Reserve raising interest rates at a blistering pace and switching from Quantitative Easing (“QE”) to Tightening (“QT”), most assets had to be marked down to the new environment. That being said, I would like to focus on the positive changes and opportunities that the new environment presents us:
- Higher yields on fixed income and cheaper equity valuations should result in better future returns. This is good for retirees (more income and investment options) and savers who are still growing their nest egg (buying at cheaper valuations).
- Fundamentals matter once again. The market is rewarding companies that generate earnings/cashflow and are valued at a reasonable price. Gone are the thematic moonshots, MEME stocks, SPACs, crypto coins and other speculative investments that were based upon a future promise (at best) and the bigger fool theory (at worst).
- TINA (There-Is-No-Alternative) has changed her name to TARA (There-Are-Reasonable-Alternatives). Since the Financial Crisis, low interest rates and QE forced investors into equities to achieve returns. Now an investor can get 4+% on short-term treasuries, 5-6% on investment grade bonds and 8-10% on high yield bonds, allowing investors to achieve solid returns without taking equity risk.
Looking forward to 2023, there are still some storm clouds on the horizon. Many expect a recession towards the end of the year, but there is still a chance that inflation cools quickly, allowing the Federal Reserve to back off before the economy crumbles. We expect continued volatility in the first half of the year as these two narratives duke it out. Beyond the volatility will be real opportunity. We just need to remain patient.
Finally, I would like to sincerely thank our amazing clients for their continued support in 2022. We love what we do and look forward to protecting and growing your nest egg over the coming years.
Sincerely,
Jonathan R. Heagle, CFP®, CFA
President and Chief Investment Officer
OVERALL MARKET COMMENTARY
In many ways 2022 was the polar opposite of the previous two years. Booming asset prices, loose fiscal and monetary policy, low inflation and high unemployment gave way to deflating asset prices, more restrained fiscal policy, extremely tight monetary policy, high inflation and tight labor markets. Given that set up, it is logical that the strong financial market returns from 2020 and 2021 morphed into one of the worst years for a simple 60% equity/40% bond portfolio in 100 years.
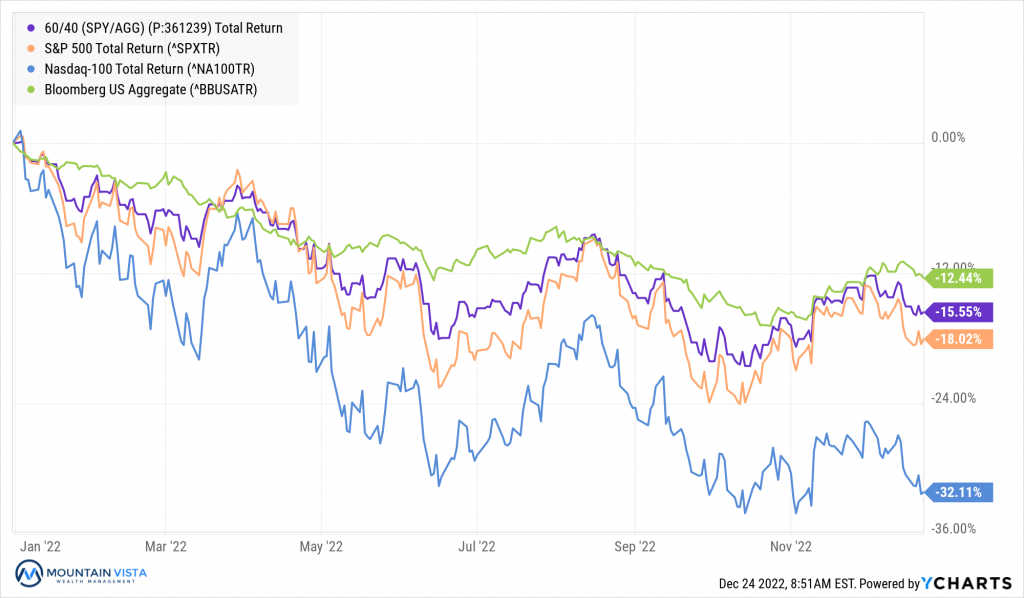
The S&P 500 and Nasdaq 100 indices ended 2022 with total returns of (-18%) and (-32%), respectively, after being down as much as (-27%) and (-35%) at their October lows. Fixed income did not fair much better, with the Bloomberg U.S. Aggregate Bond Index producing a (-13%) annual return and suffering a maximum decline of nearly (-17%) year-to-date through October 24th.
If an investor owned a portfolio comprised of 60% SPY (S&P 500 ETF) and 40% AGG (Bloomberg U.S. Aggregate Bond ETF) and rebalanced quarterly, their portfolio was down (-20%) through October 15th and ended the year down (-16%). So much for bonds as a diversification tool.
Figure 1: Year-to-Date Total Returns of Select U.S. Indices and 60/40 Portfolio
As we close 2022, there are a few reasons to be optimistic. First, inflation appears to have peaked in June at 9% and has steadily declined to 7% through November. Second, the Federal Reserve has slowed the pace of their rate hikes from 75 bps per meeting to 50 bps at the December meeting, while providing guidance that the next meeting could see the pace slow further to 25 bps. Finally, the economy has remained resilient to the massive tightening thus far.
On the other side of the coin, there are many reasons to believe that there may be more volatility ahead. First, the tight labor market has allowed wage inflation to remain elevated, which will make it hard for the Federal Reserve to achieve their target of 2% core inflation. This means rates may need to be higher for longer than the financial markets would like. Second, the economy has never seen an increase in the unemployment rate of the magnitude that the Federal Reserve is projecting without the economy experiencing a recession. Despite the poor returns in 2022, they do not fully reflect a real recession. Third, the housing market remains locked due to the extreme decline in affordability resulting from the rapid increase in mortgage rates from sub 3% to 7% in a matter of months. Housing is one of the most important sectors of the U.S. economy. Finally, the Federal Reserve does not have a good track record of soft landings. More often, they tighten until “something breaks” in the economy.
Aggressive Federal Monetary Policy
It is hard to believe that the Federal Funds rate was still at 0% in January of this year and the Federal Reserve was still buying mortgage-backed securities in March, while inflation was raging north of 7%. After realizing their error, the Federal Reserve slammed on the breaks. They have since raised the Fed Funds rate by 4.25% to the highest level since 2007 and moved from QE to QT. The Federal Reserve is now allowing up to $95 billion of treasury and mortgage bond holdings to mature without reinvesting the proceeds.
Figure 2: Consumer Price Index and Federal Funds Rate
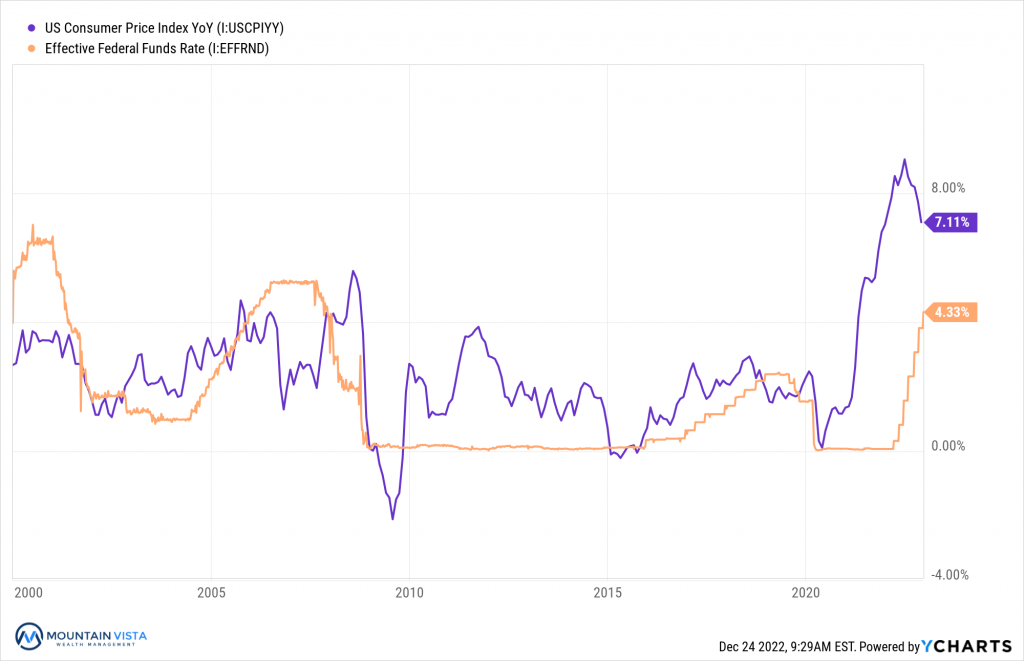
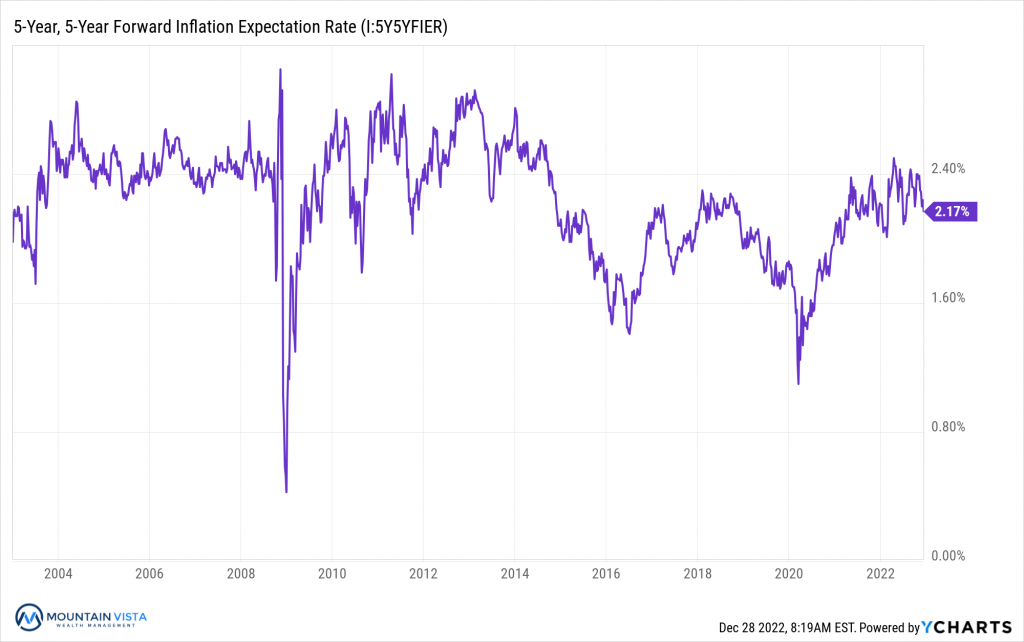
While the Federal Reserve clearly did not react quickly enough to contain near-term inflation, their aggressive moves since their hawkish pivot have allowed them to salvage the confidence of the markets. This is evident through a relatively benign move in long-term inflation expectations and market pricing of forward inflation rates. As you can see in Figure 3, the market’s 5-year inflation expectation, 5 years forward, has remained in line with its trend.
Figure 3: 5-Year, 5-Year Forward Inflation Expectation Rate
Monetary policy operates with a lag as the increased cost of money takes time to work through the economy. Most estimate that it takes 12-24 months for monetary tightening to be reflected. If this is true, we are just beginning to see the impacts of the early rate hikes and economic activity is likely to slow meaningfully in the coming year.
Inflation has turned a corner, but Fed says “not so fast!”
Heading into the December Federal Open Market Committee (FOMC) meeting, Fed Chair Powell’s message to the market was that they would not declare victory on inflation until there is “clear and convincing evidence” that inflationary pressures have eased. Many assumed that this meant that inflation was materially lower on a 3-month basis. As you can see in Figure 4, many measures of headline and core CPI and PCE, the two most followed indices, are tracking below the current Fed Funds rate.
Figure 4: Various Monthly and 3-Month Annualized Inflation vs. Federal Funds Rate
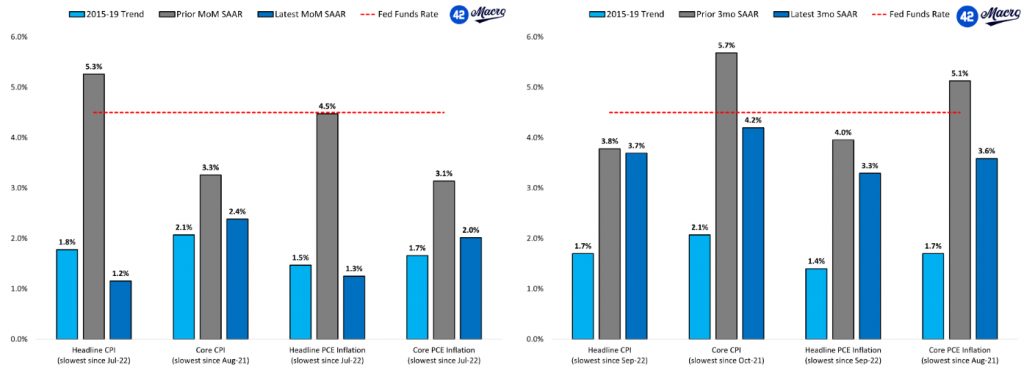
Rather than declare victory during the FOMC press conference, Chair Powell instead focused on the tight labor market and still elevated level of wage growth, which buoys demand in the services sector. According to the most recent PCE report, both Personal Income and Core Services PCE ex-Shelter were still growing over 6% annualized over the last three months.
Reinforcing the narrative that they are unlikely to reverse course from rate hikes to cuts in short order, the Summary of Economic Projections released by the Federal Reserve, showed only 2 of 19 officials saw the Fed Funds rate ending 2023 below 5%; whereas the market was expecting cuts in back half of 2023.
The market was understandably disappointed by this changing criterion and the Federal Reserve is clearly more concerned with declaring victory too early than overtightening.
EQUITY MARKET
Figure 5: Equity Index ETF Returns
| ETF | Description | Q4 2022 Total Return | 2022 Total Return |
| SPY | S&P 500 | 7.6% | (18.2%) |
| QQQ | Nasdaq 100 | (0.1%) | (32.6%) |
| IWM | Russell 2000 | 6.2% | (20.5%) |
| IVW | S&P 500 Growth | 1.3% | (29.5%) |
| IVE | S&P 500 Value | 13.5% | (5.4%) |
| VXUS | International Ex-US | 14.4% | (16.1%) |
| IEMG | Emerging Markets | 10.2% | (20.0%) |
Equity markets closed out 2022 with mixed performance in the final quarter. SPY (S&P 500 ETF) and QQQ (Nasdaq 100 ETF) returned 7.6% and (-0.1%) in the quarter, respectively, leaving them down (-18.2%) and (-32.6%) year-to-date. Once again, Intra-quarter volatility was much greater than the final tally suggests. On December 1st, SPY and QQQ were actually up 14% and 10%, respectively.
Small capitalization stocks were higher in the quarter, but modestly underperformed the S&P 500. IWM (Russell 2000 ETF) returned 6.2% in the 4th quarter and is down (-20.5%) year-to-date.
Value stocks meaningfully outperformed Growth stocks, capping off a relatively strong year. IVE (S&P 500 Value ETF) and IVW (S&P 500 Growth ETF) generated quarterly returns of 13.5% and 1.3%, respectively, and annual returns of (-5.4%) and (-29.5%), resulting in a 24% outperformance by Value in 2022.
International and Emerging Markets both outperformed the S&P 500 meaningfully in the 4th quarter, but results were mixed versus the S&P 500 for the full year. In the 4th quarter, VXUS (International ETF) returned 14.4% and IEMG (Emerging Market ETF) returned 10.2%. Annual returns were (-16.1%) and (-20.0%), respectively. Weakness in the U.S. dollar and lower interest rates provided a tailwind for non-U.S. markets, but they also benefit from a lower concentration to high-growth technology companies.
After another failed rally, it is clear that equities are still in a bear market. Despite the Federal Reserve slowing the pace of their hikes, the investors’ attention has shifted towards the timing and depth of an increasingly likely recession. We are in a “bad news is good news” market, meaning weak economic growth and job losses would increase the probability that the Federal Reserve can lower rates. We have been correct in sticking with our defensive, value tilted posture throughout 2022 and see little reason to shift until the Federal Reserve truly pivots away from a tight monetary policy.
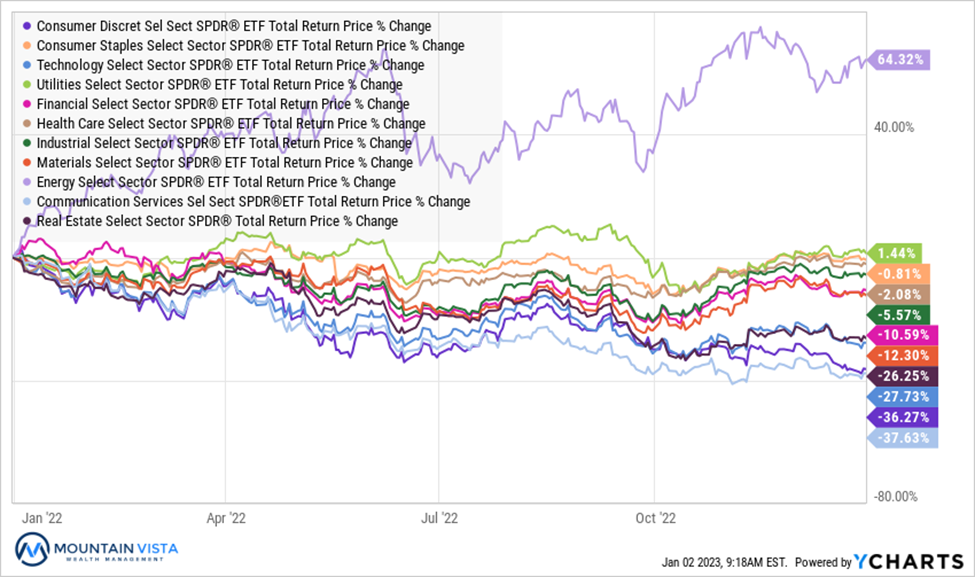
Figure 6: Equity Sector Returns
| ETF | Description | Q4 2022 Total Return | 2022 Total Return |
| XLE | Energy | 22.7% | 64.3% |
| XLI | Industrials | 19.1% | (5.6%) |
| XLB | Materials | 15.0% | (12.3%) |
| XLF | Financials | 13.4% | (10.6%) |
| XLV | Healthcare | 12.6% | (2.1%) |
| XLP | Consumer Staples | 12.5% | (0.8%) |
| XLU | Utilities | 8.5% | 1.4% |
| IYZ | Telecom | 8.2% | (30.3%) |
| XLK | Technology | 5.1% | (27.7%) |
| XLRE | Real Estate | 3.7% | (26.3%) |
| XLC | Communications | 0.5% | (37.6%) |
| XLY | Consumer Disc | (9.1%) | (36.3%) |
XLE (Energy Sector ETF) and XLI (Industrial Sector ETF) were the top performing sectors in the 4th quarter, returning 22.7% and 19.1%, respectively. For the calendar year, XLE and XLU (Utilities Sector ETF) were the only positive sectors with returns of 64.3% and 1.4%, respectively.
XLY (Consumer Discretionary Sector ETF) and XLC (Communications Sector ETF) were the worst performing sectors in the 4th quarter and on a year-to-date basis. In the quarter, XLY and XLC returned (-9.1%) and 0.5%, respectively, and (-36.3%) and (-37.6%) for 2022. These sectors continue to deflate as pandemic stimulus is slowly drained and our pre-pandemic behaviors return. A weakening economic outlook has also decreased advertising spend and caused consumers to scale back or delay discretionary purchases.
We maintain our defensive posture with a small overweight position in consumer staples. Our core VTV (Vanguard Value ETF) adds to our overweight in defensive, value-oriented sectors. We believe that growth will continue to struggle until the Federal Reserve changes its stripes.
Figure 7: Equity Sector Quarterly Total Return
FIXED INCOME MARKET
Figure 8: Fixed Income Returns
| ETF | Description | Q4 2022 Total Return | 2022 Total Return |
| AGG | Aggregate Bond | 1.6% | (13.0%) |
| BND | Total Bond Market | 1.6% | (13.1%) |
| LQD | IG Corporate | 4.2% | (17.9%) |
| JNK | HY Corporate | 4.8% | (12.2%) |
| EMB | $ EM Bonds | 8.4% | (18.6%) |
| SHY | 1-3 Yr Treasuries | 0.7% | (3.9%) |
| IEF | 7-10 Yr Treasuries | 0.6% | (15.2%) |
| TLT | 20+ Yr Treasuries | (1.9%) | (31.2%) |
| TIP | TIPs | 1.9% | (12.3%) |
Fixed income had a strong 4th quarter, as interest rates pulled back from the October highs. Short-term rates remain well above long-term rates, raising a warning flag for an up-coming recession. It is unclear if the inverted yield curve will have its usual predictive power, given how much of the U.S. treasury supply is owned by the Federal Reserve.
EMB (U.S. Dollar EM Bond ETF) performed well in the 4th quarter, returning 8.4%. The credit of Emerging Market countries that issue dollar-based debt improves as the dollar weakens, which it did meaningfully in the quarter.
TLT (20+ Year US Treasury ETF) fell (-1.9%) in the quarter and is down (-31.2%) year-to-date. TLT has the most rate sensitivity of the fixed income ETFs and was impacted by increases in long-term yields.
After rallying meaningfully in the 4th quarter, fixed income appears fairly valued, given the tug of war between higher policy rates and expected economic weakness in the medium term. We expect continued volatility in the first half of 2023 as these competing themes play out. In the medium term, we expect the correlation between stocks and bonds to decrease, providing portfolios with more diversification benefit than we experienced in 2022.
Figure 9: U.S. Treasury Yields and 2/10 Spread
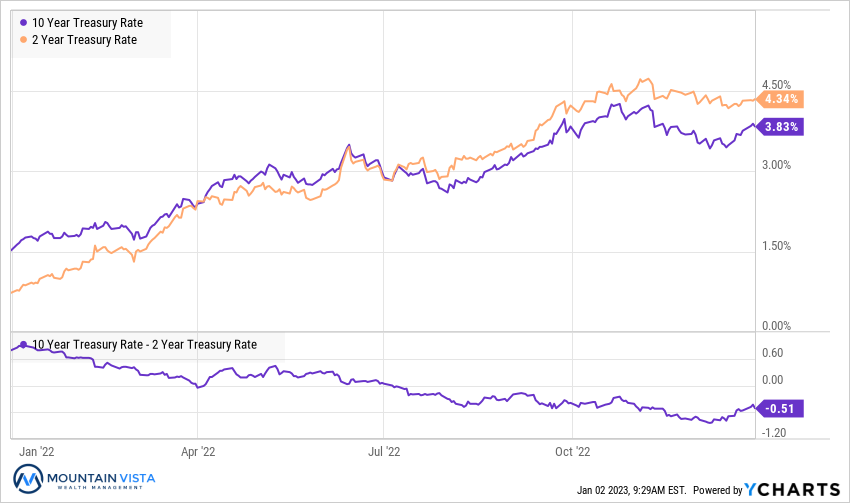
The U.S. Treasury curve remains inverted, which is a closely followed recessionary signal. In December, the Federal Reserve increased the Fed Funds rate to a range of 4.25-4.5%. Federal Reserve members expect the rate to surpass 5% during the first half of 2023. The 2-year/10-year spread ended the year at (-51 bps) after falling as low as (-0.84%) in the quarter.
While the media tends to focus on the 2-year/10-year spread, it is actually the 3-month/10-year spread that has a perfect track record of predicting a recession. This spread went negative in October and currently sits at (-62 bps).
Figure 10: U.S. Corporate Credit Spreads

Corporate credit spreads rallied in the 4th quarter but remain elevated. Credit has held up relatively well in the final month of 2022, despite the weakness in the equity markets. Looking forward, credit’s path will be dictated by the path of the economy. If the economy remains resilient, credit offers good value. That said, spreads do not fully reflect a significant recession and default cycle.
CCC-rated bond spreads tightened by (-124 bps), while AA-rated bond spreads tightened by
(-20 bps). While lower credit bonds experienced larger decreases in spreads on an absolute basis, the tightening up the credit curve was more meaningful on a percentage basis.
We are watching CCC spreads very closely heading into 2023. They are a key indicator of a faltering economy and recessionary risk. True periods of stress tend to see spreads gap wider in short order. Thus far, the movement of spreads has been very orderly.
CONCLUSION
While 2022 has been a challenging year for investors, I want to end on a positive note. I am truly excited about the investment opportunities looking forward. I would much rather buy bonds at 5-10% yield and stocks at depressed price-to-earnings multiples than the nosebleed valuations of the prior 10 years. We have been playing defense over the last year, so that we can reap the rewards when facts change.
In real estate, there is a concept called “buying right”. At a high level, this means negotiating a purchase price that is conservative enough to protect against unexpected expenses and/or changing market conditions. Said another way, a low purchase price provides a margin of safety. While the financial markets can certainly get cheaper near-term, valuations are reflecting a lot of uncertainty, and long-term investors are likely buying right.
Periods of transition and uncertainty feel uncomfortable, but they do end. The market will anticipate this shift long before it is obvious to most professional investors and definitely before it is reported on CNBC or in a newspaper. That is why it is important to stay invested!
Thank you all for another successful year! We are dedicated to helping you navigate this uncertain time and are constantly looking for ways to improve the risk-reward profile of your investment portfolio.
Sincerely,
Jonathan R. Heagle, CFP®, CFA
President and Chief Investment Officer
Disclaimer
The views and opinions expressed are for informational and educational purposes only as of the date of writing and may change at any time based on market or other conditions and may not come to pass. This material is not intended to be relied upon as investment advice or recommendations, does not constitute a solicitation to buy or sell securities and should not be considered specific legal, investment or tax advice. The information provided does not take into account the specific objectives, financial situation, or particular needs of any specific person. All investments carry a certain degree of risk and there is no assurance that an investment will provide positive performance over any period of time. Equity investments are subject to market risk or the risk that stocks will decline in response to such factors as adverse company news or industry developments or a general economic decline. Debt or fixed income securities are subject to market risk, credit risk, interest rate risk, call risk, tax risk, political and economic risk, and income risk. As interest rates rise, bond prices fall. Non-investment-grade bonds involve heightened credit risk, liquidity risk, and potential for default. Foreign investing involves additional risks, including currency fluctuation, political and economic instability, lack of liquidity and differing legal and accounting standards. These risks are magnified in emerging markets. Past performance is no guarantee of future results.