
INTRODUCTION
“Pain trade is the tendency of markets to deliver the maximum amount of punishment to as many investors as possible from time to time.” -Adam Hayes, Investopedia
Coming into 2023, it seemed obvious that a recession was coming and there was no reason to take risk in the equity markets with short-term yields above 4% and heading higher. If you were to take equity risk, it should definitely not be in the technology sector. Investors became too complacent with this view.
In September of 2022, the American Association of Individual Investors sentiment survey reported that the percent of bearish investors reached 60.87%, versus only 17.73% identifying as bullish. The (-43%) bull-bear spread was only lower during the Persian Gulf war and the depths of the Global Financial Crisis. When sentiment and positioning become extreme, be it bullish or bearish, the market tends to move in the opposite direction. This is called the “pain trade”.
With this set up, any outcome other than the worst-case scenario tends to push prices higher. Add a positive catalyst, such as Chat GPT and Artificial Intelligence, and prices are prone to move much higher. This is the recipe that produced the 39% year-to-date return for the Nasdaq 100 in 2023.
Recognizing these opportunities is easy in hindsight, but difficult in real time. When trying to time the market, one must successfully time both the exit and re-entry to produce alpha over the medium term. Many investors that have the foresight to sell before a fall, stay underinvested for too long as they wait for the smoke to clear or for “next shoe to drop”. By the time it feels safe to re-enter the market, prices may even be higher than they sold in the first place.
At Mountain Vista, we rarely make all-or-none changes to long-term asset allocations. We encourage our clients to be patient and strategic, not emotional, when considering a change.
The best time to manage risk is when no one sees it and the ideal time to take risk is typically when it makes you sick to your stomach.
Thank you to all of our clients for their continued support!
Sincerely,
Jonathan R. Heagle, CFP®, CFA
President and Chief Investment Officer
OVERALL MARKET COMMENTARY
In the 2nd quarter, the stock market added to its gains, bringing the year-to-date total returns of the S&P 500 and Nasdaq 100 to 17% and 39%, respectively. The strength of the rally has surprised most and frustrated many.
Heading in to 2023, the clear consensus was underweight technology and overweight value, energy and financials. This offside positioning, in conjunction with the excitement surrounding artificial intelligence, created the conditions for a spectacular rally in large cap technology stocks.
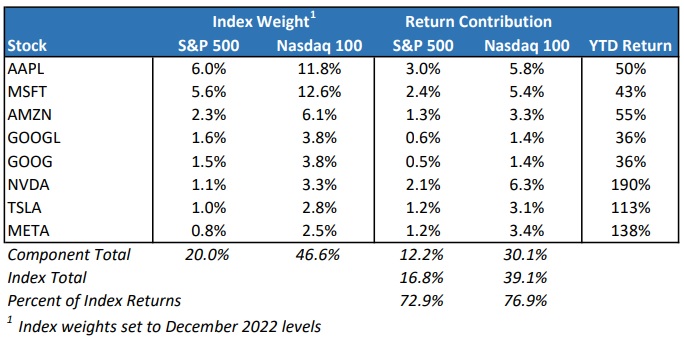
While the gains have been impressive at the index level, most of those gains have been driven by the newly dubbed “Magnificent Seven”, comprised of Apple, Amazon, Google, Meta, Microsoft, Nvidia, and Tesla. This narrow market leadership is often cited by bearish market commentators to highlight the fragility of the rally.
Providing additional support to the equity market were the stability in long-term interest rates, continued disinflation, and a less aggressive Federal Reserve. Finally, fallout from this Spring’s regional bank crisis appears to be contained, as deposit flight has slowed materially.
While inflation is still a concern of the market, CPI has been more than cut in a half from a peak 9.1% in June 2022 to 4.0% as of the May 2023 reading. The Shelter component, which has been stubbornly high, fell marginally from 8.1% to 8.0%, but is expected to come down over the next few months. That being said, further improvement in the second half of the year may prove challenging as the high inflation months from last Spring and Summer fall out of the year-over-year dataset.
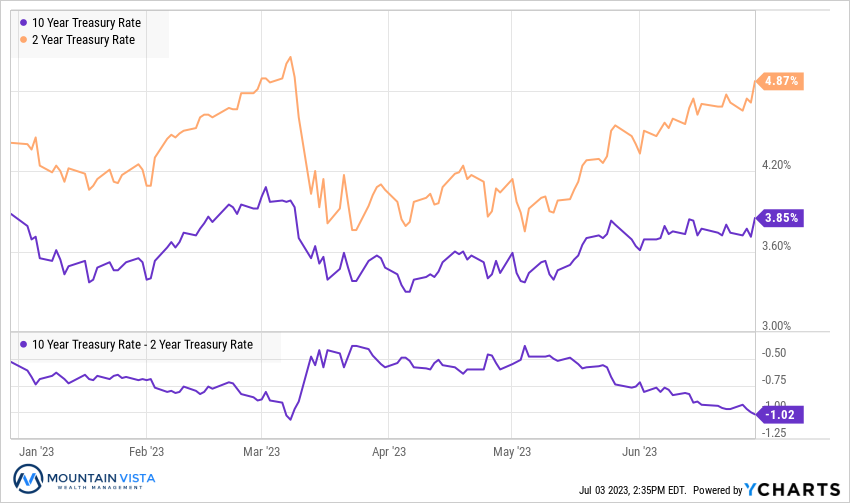
Despite continued strength in the economy, 10-year U.S. Treasury bond yields have been rangebound since peaking in ~4.3% in October 2022. The 10-year yield has ranged between 3.25% and 4% for most of 2023. The market currently believes that the Federal Reserve will manage to get inflation under control in the medium to long-term.
Artificial Intelligence Boosts Big Tech and Indices
Artificial intelligence has been in development for years at the major technology companies, but it was not until OpenAI released Chat GPT last November that the general investing public began to focus on the opportunities and potential impacts to existing business models.
While it is clear that Nvidia stands to benefit in the short-term, we are a long way from knowing who the ultimate winners and losers will be. It took many years after the internet became mainstream for today’s technology behemoths to develop. While existing technology companies will surely benefit, the next Google or Amazon may just be getting started.
As you can see in Figure 1, the top 7 technology stocks are up 82% year-to-date on average. NVDA and META are up an astounding 189% and 138%, respectively! After applying each stock’s index weighting, the Magnificent Seven account for approximately three-quarters of S&P 500 and Nasdaq 100 total year-to-date returns. While such narrow leadership is not categorically bad, it does raise eyebrows. We would like to see the market strength broaden out to other sectors.
Figure 1: Big Techs’ Impact on Index Returns Year-to-Date
While the potential economic benefits of artificial intelligence are indeed exciting, the future returns of related stocks do not have to follow suit. Eventually a stock can get so expensive that its future performance can no longer support the price.
Figure 2: Forward Price-to-Sales Ratios of Big Tech
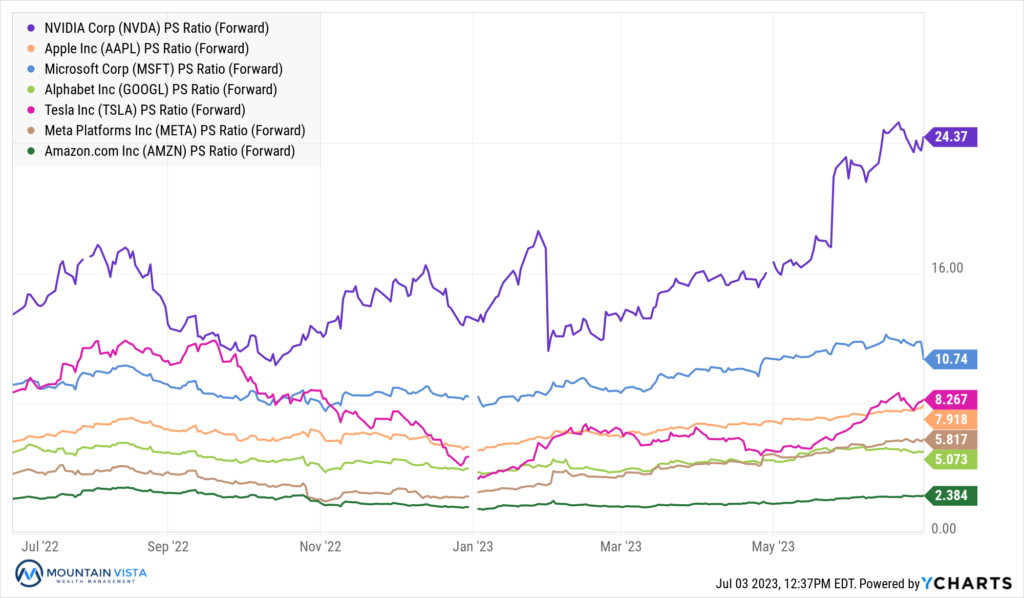
Nvidia’s stock currently trades at 41x trailing 12-month sales. To be fair, their trailing revenue does not fully reflect the expected growth, but they still trade at 24x forward sales. For context, Microsoft trades at 12.3x trailing 12-month sales and 10.7x forward sales. Apple, Google, Tesla, Meta and Amazon all sport forward price-to-sales ratios in the single digits.
While Nvidia may find ways to grow into its valuation, Cisco Systems Inc’s experience during the Dot Com bubble has eerie parallels that should give any investor cause for concern.
Cisco was the “picks and shovels” beneficiary of the internet boom, supplying the necessary IT hardware, software and networking equipment. Fundamentals were strong and investors piled into the name, looking to profit from the modern-day gold rush.
Figure 3: Cisco System Inc’s Stock Price and Price-to-Sales Ratio
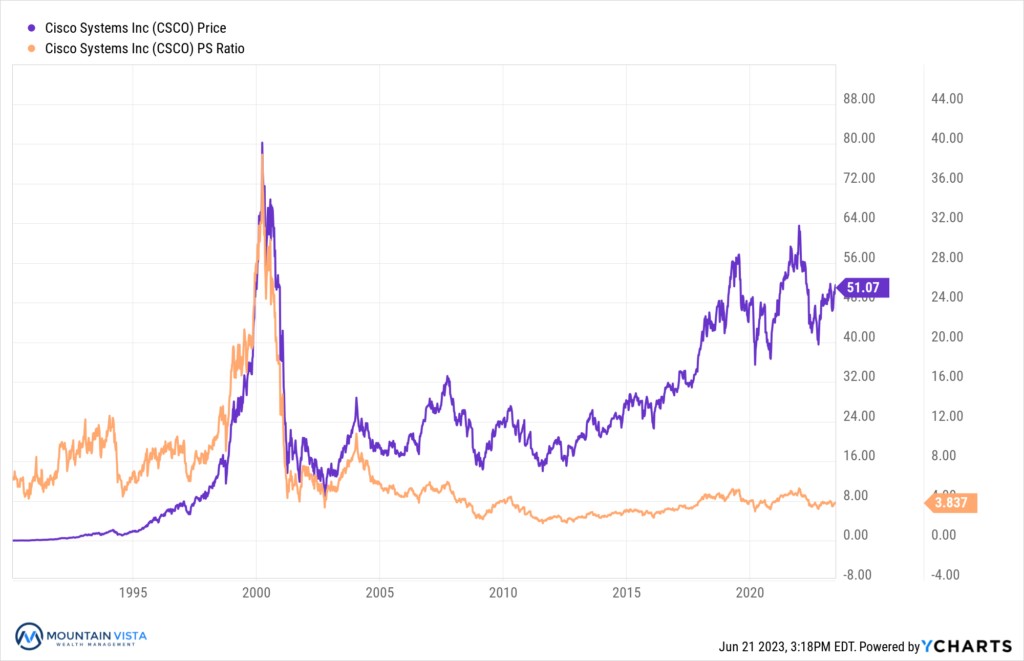
From October 27, 1998 to March 27, 2000, Cisco’s stock returned 428% and its price-to-sales ratio exploded from 12x to 39x. After this massive rally, the stock went on to crash by 80% over the next two years after the mania calmed down. Here is what the Financial Times had to say:
“In one way, investors were right. Cisco was a big winner. Over the next 21 years, Cisco’s revenues grew four fold to $49bn, with profits quintupling to $11bn. Return-on-equity even improved, with the figure averaging 17 per cent over the next two decades, 3 percentage points above its 2000 number.
The problem was the share price. It was, simply, too damn high. At the March 2000 peak, Cisco’s price-to-earnings ratio stood at 201 times, its enterprise value to sales at 31 times and its price-to-free cash flow at 176 times. By anyone’s standards, the valuation was over-egged.”
Time will tell if today’s valuations are justified, but at the current stock price, investors are pricing in a lot of good news.
EQUITY MARKET
Figure 4: Equity Index ETF Returns
| ETF | Description | Q2 2023 Total Return | 2023 YTD Total Return |
| SPY | S&P 500 | 8.7% | 16.8% |
| QQQ | Nasdaq 100 | 15.3% | 39.1% |
| IWM | Russell 2000 | 5.3% | 8.1% |
| IVW | S&P 500 Growth | 10.6% | 21.1% |
| IVE | S&P 500 Value | 6.6% | 12.0% |
| VXUS | International Ex-US | 2.7% | 9.9% |
| IEMG | Emerging Markets | 2.0% | 6.6% |
Equity markets added to gains in the 2nd quarter of 2023. SPY (S&P 500 ETF) and QQQ (Nasdaq 100 ETF) returned 8.7% and 15.3% in the quarter, respectively, resulting in year-to-date gains of 14.8% and 39.1%, respectively. The Nasdaq 100 outperformed the S&P 500, given its relatively high exposure to large technology stocks.
Small capitalization stocks were also higher in the quarter, but underperformed the S&P 500 by (-4.0%). IWM (Russell 2000 ETF) returned 5.3% in the 2nd quarter and 8.1% year-to-date. The ratio of the Russell 2000 over the S&P 500 is at depressed levels last seen during the “Dotcom Bubble” of the last 90s/early 2000s.
Growth stocks outperformed Value stocks for the 2nd quarter in a row, reversing Value’s dominance during the prior year. IVW (S&P 500 Growth ETF) and IVE (S&P 500 Value ETF) generated quarterly returns of 10.6% and 6.6%, respectively, resulting in a 4% outperformance by Growth during the quarter and 9% year-to-date.
International and Emerging Markets both lagged the S&P 500 meaningfully in the 2nd quarter. VXUS (International ETF) and IEMG (Emerging Market ETF) produced returns of 2.7% and 2.0%, respectively. The underperformance is mostly explained by the strong performance of U.S. Large-Cap Technology stocks, but the US Dollar modestly strengthened during the quarter too.
Sentiment has improved materially from late last year, but there is still a lot of skepticism in this year’s rally from institutional investors. The market is not exactly cheap with a forward price-to-earnings ratio on the S&P 500 of 19x. Also, the Conference Board Leading Economic Index continues to deteriorate at a pace consistent with recession. That being said, 2024 earnings expectations are increasing and employment remains strong.
While we are marginally underweight equities, we removed our value tilt in the 1st quarter and our defensive sector holdings in the 2nd quarter. We have also increased our exposure to small capitalization stocks.
Figure 5: Equity Sector Returns
| ETF | Description | Q2 2023 Total Return | 2023 YTD Total Return |
| XLK | Technology | 15.4% | 40.3% |
| XLY | Consumer Disc | 13.8% | 32.1% |
| XLC | Communications | 12.4% | 36.2% |
| XLI | Industrials | 6.5% | 10.2% |
| XLF | Financials | 5.3% | (0.5%) |
| XLB | Materials | 3.2% | 7.7% |
| XLV | Healthcare | 2.9% | (1.5%) |
| XLRE | Real Estate | 1.8% | 3.8% |
| XLP | Consumer Staples | (0.0%) | 0.7% |
| XLE | Energy | (1.1%) | (5.4%) |
| XLU | Utilities | (2.5%) | (5.7%) |
| IYZ | Telecom | (4.0%) | (0.2%) |
High beta sectors continue to lead the recovery in 2023. XLK (Technology Sector ETF), XLY (Consumer Discretionary ETF), and XLC (Communications Sector ETF) were the top performing sectors in the 2nd quarter, returning 15.4%, 13.8%, and 12.4%, respectively. Conversely, these were three of the hardest hit sectors in 2022, so it is natural that they are leading the recovery.
IYZ (Telecom Sector ETF) and XLU (Utilities Sector ETF) were the worst performing sectors in the 2nd quarter. IYZ and XLU returned (-4.0%) and (-2.5%), respectively. These defensive and income-oriented sectors have lagged in 2023 because of competition from high short-term interest rates and overly defensive positioning amongst investors heading into 2023.
We have removed most sector exposures in our moderate to high-risk portfolios, other than a small XLV (Healthcare Sector ETF) overweight.
Figure 6: Equity Sector Quarterly Total Return

FIXED INCOME MARKET
Figure 7: Fixed Income Returns
| ETF | Description | Q2 2023 Total Return | 2023 YTD Total Return |
| AGG | Aggregate Bond | (0.9%) | 2.3% |
| BND | Total Bond Market | (0.8%) | 2.4% |
| LQD | IG Corporate | (0.4%) | 4.3% |
| JNK | HY Corporate | 0.8% | 5.0% |
| EMB | $ EM Bonds | 1.6% | 4.4% |
| SHY | 1-3 Yr Treasuries | (0.6%) | 1.0% |
| IEF | 7-10 Yr Treasuries | (1.9%) | 2.0% |
| TLT | 20+ Yr Treasuries | (2.5%) | 4.7% |
| TIP | TIPs | (1.5%) | 2.0% |
Fixed income was mixed in the 2nd quarter, with High Yield and Emerging Market debt generating positive returns, while U.S. Treasuries and rate sensitive bonds experienced losses. Rate sensitive bonds suffered as the yield curve shifted higher.
EMB (Dollar Emerging Market Bond ETF) and JNK (High Yield Bond ETF) produced returns of 1.6% and 0.8%, respectively. Carry generated from their relatively high coupons offset the increase in rates.
TLT (20+ Year US Treasury ETF) gave back (-2.5%) in the quarter, leaving it up 4.7% year-to-date. Also, lagging was TIP (U.S. Treasury Inflation Protected ETF) with a (-1.5%) return in the 2nd quarter.
The persistent strength of the economy and easing of bank stress have us expecting more rate hikes over the next few months. That being said, monetary policy is now in restrictive territory with the Federal Funds rate ~1% above CPI, so the Federal Reserve’s work is near complete.
Figure 8: U.S. Treasury Yields and 2/10 Spread
In June, the Federal Reserve left the Federal Funds rate unchanged at 5.00% to 5.25%. They also released their revised Summary of Economic Projections, which showed that all but two FOMC participants expected at least one more rate hike and a majority expected two or more.
The U.S. Treasury curve remains inverted, which is a closely followed recessionary signal. The 2-year/10-year spread ended the quarter at (-102 bps) reversing the steepening experienced during the regional bank stress.
While the media tends to focus on the 2-year/10-year spread, it is actually the 3-month/10-year spread that has a perfect track record of predicting a recession. This spread went negative in October 2022 and currently sits at (-161 bps).
Figure 9: U.S. Corporate Credit Spreads
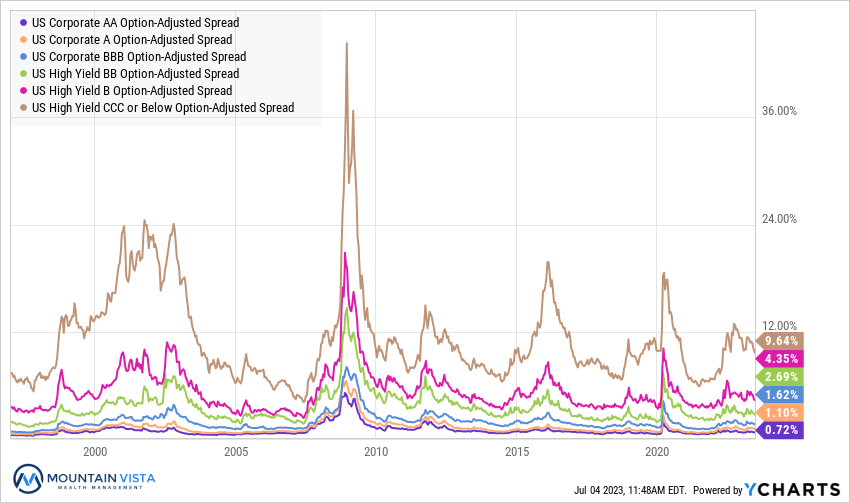
Corporate credit spreads drifted lower over the course of the 2nd quarter, recovering from the widening experienced during the regional banking stress. While the stock market did not bottom until October 2022, the peak in credit spreads occurred in March 2022. On the other hand, yields on credit did peak concurrently with equities.
During the quarter, CCC-rated bond spreads tightened by (-166 bps), while AA-rated bond spreads widened by (-8 bps). Despite the move tighter, spreads are still elevated in anticipation of a potential recession.
We continue to watch CCC spreads as an indicator of recession risk. Right now, they are not pricing in an imminent risk of recession.
CONCLUSION
At the end of a bear market, it is common to see prices react in counterintuitive ways to new data. For example, a stock rallies after reporting a bad earnings report or the market moves higher after an economic release that is worse than expected. These are signals that the market has priced in the bad outcome and future returns are likely skewed towards the upside.
In hindsight, there were many such instances over the past nine months. Despite the strong movement higher in stock prices, many remain on the sidelines, focused on the negative catalysts that the market priced in last year. This persistent negative sentiment is fuel for the rally to continue as bears are converted to bulls.
2023 has been another reminder to avoid overreacting to constant gyrations of the market. As humans, our behavioral biases will nudge us to sell at the lows and chase at the highs. Fear and greed are powerful emotions and stem from our survival instincts and desire to part of a group. Follow them at your own peril.
Thank you all for your continued support! We are dedicated to helping you navigate this uncertain time and are constantly looking for ways to improve the risk-reward profile of your investment portfolio.
Sincerely,
Jonathan R. Heagle, CFP®, CFA
President and Chief Investment Officer
Disclaimer
The views and opinions expressed are for informational and educational purposes only as of the date of writing and may change at any time based on market or other conditions and may not come to pass. This material is not intended to be relied upon as investment advice or recommendations, does not constitute a solicitation to buy or sell securities and should not be considered specific legal, investment or tax advice. The information provided does not take into account the specific objectives, financial situation, or particular needs of any specific person. All investments carry a certain degree of risk and there is no assurance that an investment will provide positive performance over any period of time. Equity investments are subject to market risk or the risk that stocks will decline in response to such factors as adverse company news or industry developments or a general economic decline. Debt or fixed income securities are subject to market risk, credit risk, interest rate risk, call risk, tax risk, political and economic risk, and income risk. As interest rates rise, bond prices fall. Non-investment-grade bonds involve heightened credit risk, liquidity risk, and potential for default. Foreign investing involves additional risks, including currency fluctuation, political and economic instability, lack of liquidity and differing legal and accounting standards. These risks are magnified in emerging markets. Past performance is no guarantee of future results.