
INTRODUCTION
“History provides a crucial insight regarding market crises: they are inevitable, painful and ultimately surmountable.” – Shelby M.C. Davis
The stock market produced stellar returns in 2023! Let’s raise our glasses in celebration of a great year.
The market’s strong performance was not anticipated by many 12 months ago. 2023 was yet another reminder that investing is hard and it is best to avoid making emotional changes to your investment strategy during market corrections or periods of euphoria. Those of us that waited out the volatility of the last two years have been handsomely rewarded.
Before we dig into the market performance in the 4th quarter, and our thoughts on what may lie ahead in 2024, a few housekeeping items need to be addressed:
- There will be a slight change to the format of the investment letters moving forward. Rather than comment on the different markets and sectors piecemeal throughout the letter, there will be one main commentary after our introductory comments. This is an attempt to consolidate what is important in one place. We will continue to include the detailed charts after the commentary in an appendix for those that like a little more data. If you have any feedback on the new format, good or bad, feel free to share it!
- We are always looking for ways to improve. We would greatly appreciate it if you would share one or two suggestions that you may have to improve your experience as a client.
Finally, we wanted to say thank you for continuing to work with us for another year. We are humbled and honored to be your trusted partner. It is our clients that allow us to do the work that we love. Happy new year!
Sincerely,
Jonathan R. Heagle, CFP®, CFA
President and Chief Investment Officer
QUARTERLY ROUNDUP
After a sluggish start in October, the final two months of the quarter were exceptionally strong. The S&P 500 returned 16.2% from October 27th, resulting in a staggering 26.2% total return in 2023. This was only to be outdone by the 54.9% annual return for the Nasdaq 100.
While the “Magnificent 7” large capitalization technology stocks did the heavy lifting for the first three quarters of 2023, in the final quarter we saw the gains broaden out to other sectors, such as Real Estate and Financials.
While most investors were not expecting this type of performance in 2023, it was very clear that valuations in stocks and bonds were much more attractive than they had been in years, as we noted just last quarter.
Figure 1: Total Returns of U.S. Equity Indices

The Spark that Ignited a Year-End Rally
You never know exactly what is going to set off the next move higher, but when the market is reasonably priced and confidence is low, upside surprises can produce dramatic results. This is what we witnessed over the last two months.
In this instance there were two major events that kicked off the rally: 1) a better than feared composition of U.S. Treasury issuance and 2) a pivot in the posture of the Federal Reserve.
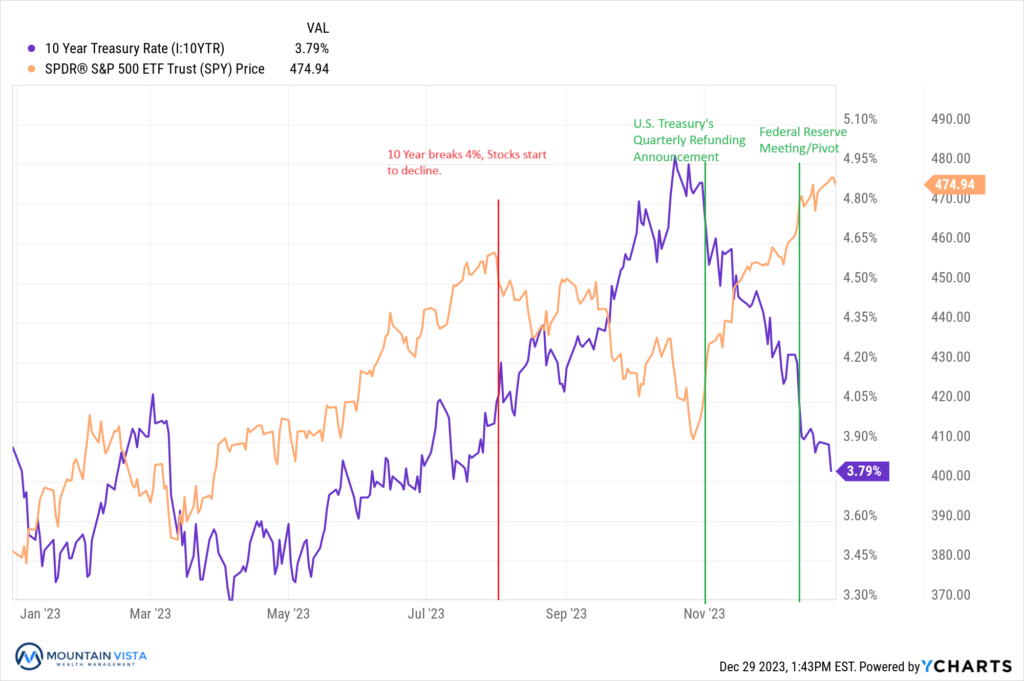
Heading into the Treasury’s Quarterly Refunding Statement, the U.S. 10-year Treasury yield was dancing just below 5%, after spiking ~1% over the previous month. What was important about the refunding statement was that the Treasury concentrated their issuance to shorter bonds and T-bills, rather than saturating the market with longer-dated bonds.
This action signaled that they had taken note of the recent market weakness and were tacitly supporting longer-dated bonds. Yields quickly began to fall back down to Earth. As a reminder, yields move inversely to prices.
As you can see below, once the 10-year U.S. Treasury yield breeched 4%, further increases in bond yields from July to October pressured the stock market. The refunding announcement short-circuited this downward spiral and yields started to reverse lower, providing oxygen for equities to rally.
Figure 2: S&P 500 ETF Price and U.S. 10-year Treasury Yield
Furthermore, the Federal Open Market Committee’s (FOMC) meeting on December 13th provided additional fuel for the fire. As you can see below, the Summary of Economic Projections showed the committee expected lower inflation, higher growth and relatively stable employment. Also, the committee did not anticipate further rate increases and expected rates to fall more quickly in 2024/5.
Figure 3: Federal Reserve Summary of Economic Projections
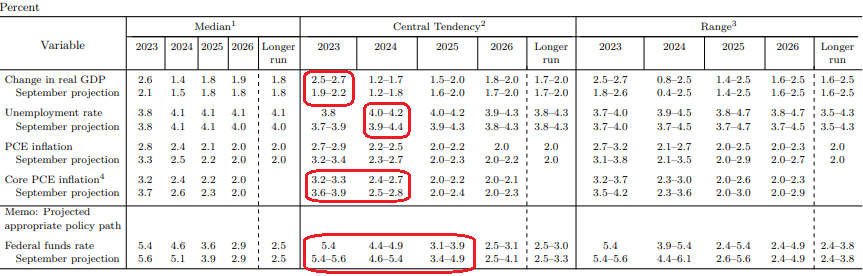
During the press conference, Federal Reserve Governor, Jerome Powell, stated that they will proceed with a more balanced evaluation of inflation and employment, rather than focus acutely on the inflation portion of their dual mandate. That is as close as we’ll get to a declaration of victory over inflation!
The 60/40 Portfolio is Alive and Well
Both the equity and bond markets celebrated the Federal Reserve’s dovish pivot by building upon the one of the strongest trailing 2-month returns for a portfolio comprised of 60% stocks and 40% bonds, or the much referenced “60/40 portfolio”, since 1990.
Figure 4: 60% S&P 500 and 40% Bloomberg Aggregate Bond Index Rolling Two Month Returns

Source: Bespoke Investment Group
What is unique about this period, is that the bond portion of the 60/40 portfolio has produced sizeable gains; whereas, stocks did most of the heavy lifting in both 2009 and 2020.
An Unexpected Outcome at the Sector Level
2023 was not just a year that surprised at the headline level, but also in the details. Coming into the year, Technology was one of the most shunned sectors and Energy was a top pick for many investors. As so often happens, the exact opposite played out.
Technology and Communication Services (Google and Meta) exploded higher in January and barely looked back. On the other hand, Energy struggled all year, along with defensive sectors, such as Consumer Staples and Utilities, and was basically flat on the year.
Figure 5: U.S. Equity Sector Total Returns

Looking Forward to 2024
Our expectation is for the stock market to produce further gains in 2024, albeit more modest than 2023. Sentiment has improved substantially from last year, but it is by no means exuberant. Also, 2023 returns were strong, but the stock market is basically flat over a two-year time horizon. Absent a substantial decline in economic activity, we believe investors, who are still under allocated to equities, should provide support to the markets.
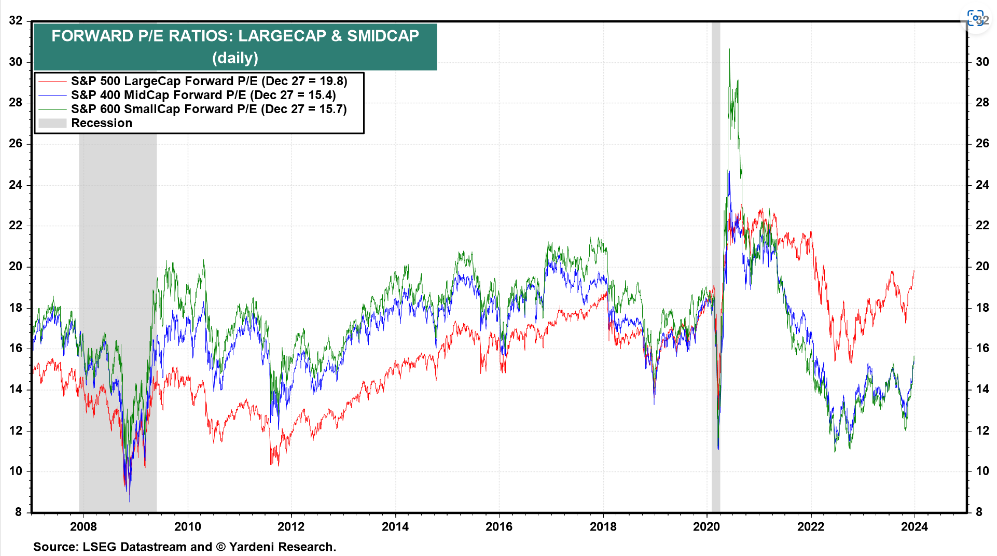
While the gains in 2023 were top heavy, with the largest stocks driving the indices higher, in 2024 we expect a broadening of market participation. This means cheaper, small and mid-capitalization stocks should outperform. As you can see below, their forward price-to-earnings ratios have lagged both large-capitalization stocks and their long-term average.
Figure 6: Forward Price-to-Earnings Ratios of U.S. Equities by Capitalization
While technology will likely continue to perform well if the market is higher, beaten-up and under-owned sectors, such as Real Estate and Financials, may outperform 2023’s winners as they are valued at lower multiples and are under owned by most investors.
Fixed income appears fairly valued to slightly rich in our opinion. In a world of 2% inflation and 2% real growth, a 4% yield on the 10-year U.S. Treasury is very reasonable. The risk to fixed income is that growth holds up and the aggressive rate cuts that have been priced into Fed Fund futures come unwound. Without continued disinflation and slowing growth, it is unlikely that long-term yields can fall much further.
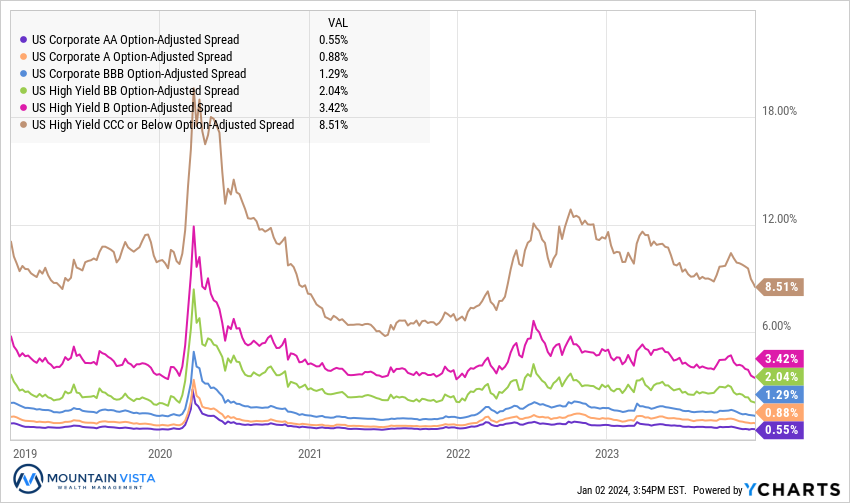
Except for the lowest rated bonds, credit spreads have erased all of the widening of 2022 and are back at levels seen in 2021 or 2019. With spreads at or near historic tights, investment grade and high yield bonds will likely rely on a decline in U.S. Treasury yields to produce returns beyond their coupons.
Risks to our outlook include:
- A rebound in inflation driven by the loosening of financial conditions in Q4 2023 that leads to a hawkish reversal in Federal Reserve policy
- A contested U.S. Presidential election or a generally disorderly outcome
- Escalating geopolitical tension, especially between U.S. and China over Taiwan
- As always, a true black swan event that no one is expecting, such as a pandemic or massive cyber attack
Since we cannot predict if or when any of these events will occur, we are not explicitly positioning for their outcome. To the extent they become increasingly likely, we will take the appropriate actions to safeguard your investments as needed.
We hope you all enjoyed the new abbreviated format. You will find all of the usual market data in the Appendix.
Wishing you all a happy and healthy new year!
APPENDIX
Equity Index ETF Total Return
| ETF | Description | Q4 2023 Total Return | Since October 27, 2023 | 2023 YTD Total Return |
| SPY | S&P 500 | 11.6% | 16.2% | 26.2% |
| QQQ | Nasdaq 100 | 14.6% | 18.9% | 54.9% |
| IWM | Russell 2000 | 14.0% | 24.2% | 16.8% |
| IVW | S&P 500 Growth | 10.1% | 14.5% | 29.8% |
| IVE | S&P 500 Value | 13.6% | 18.3% | 22.1% |
| VXUS | International Ex-US | 9.9% | 15.2% | 15.9% |
| IEMG | Emerging Markets | 8.4% | 12.8% | 11.5% |
U.S. Equity Sector Total Return
| ETF | Description | Q4 2023 Total Return | Since October 27, 2023 | 2023 YTD Total Return |
| XLRE | Real Estate | 18.8% | 25.1% | 12.4% |
| XLK | Technology | 17.7% | 19.7% | 56.0% |
| XLF | Financials | 13.9% | 20.1% | 12.0% |
| XLI | Industrials | 13.1% | 18.8% | 18.1% |
| XLY | Consumer Disc | 11.3% | 19.7% | 39.6% |
| XLC | Communications | 11.1% | 15.5% | 52.8% |
| XLB | Materials | 9.7% | 14.9% | 12.5% |
| XLU | Utilities | 8.5% | 8.8% | (7.2%) |
| IYZ | Telecom | 7.4% | 15.0% | 3.9% |
| XLV | Healthcare | 6.4% | 11.2% | 2.1% |
| XLP | Consumer Staples | 5.5% | 9.0% | (0.8%) |
| XLE | Energy | (6.4%) | 0.0% | (0.6%) |
U.S. Equity Sector Total Return

Global Equity ETF Total Return

Fixed Income ETF Total Return
| ETF | Description | Q4 2023 Total Return | Since October 27, 2023 | 2023 YTD Total Return |
| AGG | Aggregate Bond | 6.8% | 8.1% | 5.7% |
| BND | Total Bond Market | 6.6% | 8.0% | 5.7% |
| LQD | IG Corporate | 10.1% | 12.3% | 9.4% |
| JNK | HY Corporate | 7.2% | 8.7% | 12.4% |
| EMB | $ EM Bonds | 9.8% | 11.3% | 10.6% |
| SHY | 1-3 Yr Treasuries | 2.5% | 2.1% | 4.2% |
| IEF | 7-10 Yr Treasuries | 6.4% | 7.9% | 3.6% |
| TLT | 20+ Yr Treasuries | 12.9% | 18.4% | 2.8% |
| TIP | TIPs | 4.5% | 4.9% | 3.8% |
U.S. Treasury Yields and 2/10 Spread
U.S. Corporate Credit Spreads
Disclaimer
The views and opinions expressed are for informational and educational purposes only as of the date of writing and may change at any time based on market or other conditions and may not come to pass. This material is not intended to be relied upon as investment advice or recommendations, does not constitute a solicitation to buy or sell securities and should not be considered specific legal, investment or tax advice. The information provided does not take into account the specific objectives, financial situation, or particular needs of any specific person. All investments carry a certain degree of risk and there is no assurance that an investment will provide positive performance over any period of time. Equity investments are subject to market risk or the risk that stocks will decline in response to such factors as adverse company news or industry developments or a general economic decline. Debt or fixed income securities are subject to market risk, credit risk, interest rate risk, call risk, tax risk, political and economic risk, and income risk. As interest rates rise, bond prices fall. Non-investment-grade bonds involve heightened credit risk, liquidity risk, and potential for default. Foreign investing involves additional risks, including currency fluctuation, political and economic instability, lack of liquidity and differing legal and accounting standards. These risks are magnified in emerging markets. Past performance is no guarantee of future results.