
INTRODUCTION
“Far more money has been lost by investors in preparing for corrections, or anticipating corrections, than has been lost in the corrections themselves.”
– Peter Lynch
Looking back at 2025, financial market investors have much to celebrate. Equities, fixed income, and gold have all delivered strong returns. Bitcoin and other crypto assets stand as the sole disappointment in what has otherwise been a remarkable period.
With hindsight, investing may appear straightforward. But it’s crucial to remember that capturing these gains required staying invested through April’s turbulence, when “Liberation Day” tariffs sent the S&P 500 plummeting 12% in a single week—nearly 20% from its peak.
Market timing and extrapolation remain two habits that consistently erode investor returns.
Market timing: Anyone who sold stocks on April 2nd, the day before Liberation Day, had less than a month to re-enter and capture the year’s strong gains. Timing both the exit and re-entry is extremely difficult. Build a portfolio you can live with and stay invested.
Extrapolation: Our minds love extrapolating, which fuels bubbles, crashes, and dismal returns. Strong past performance drives attention, speculation, and FOMO. New money chases hot investments, pushing prices higher until the cycle exhausts itself and the bubble bursts. The reverse occurs after crashes: we feel reckless and irresponsible. Cash seems safe when prices keep falling. Selling at depressed levels destroys years of compounded returns.
As we enter 2026 following three consecutive years of double-digit stock gains, don’t fall into these behavioral traps. Stay focused on your long-term asset allocation and investment goals.
We’re grateful to work with such thoughtful, engaged clients, and we never take your trust for granted. Thank you for allowing us the privilege of safeguarding your hard-earned savings.
Sincerely,
Jonathan R. Heagle, CFP®, CFA
President and Chief Investment Officer
QUARTERLY ROUNDUP
Market Performance Overview
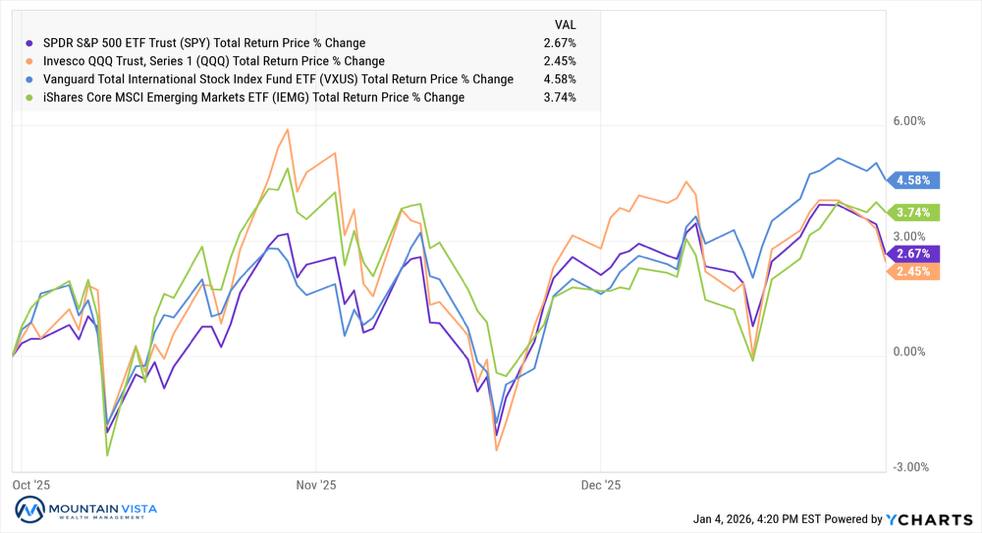
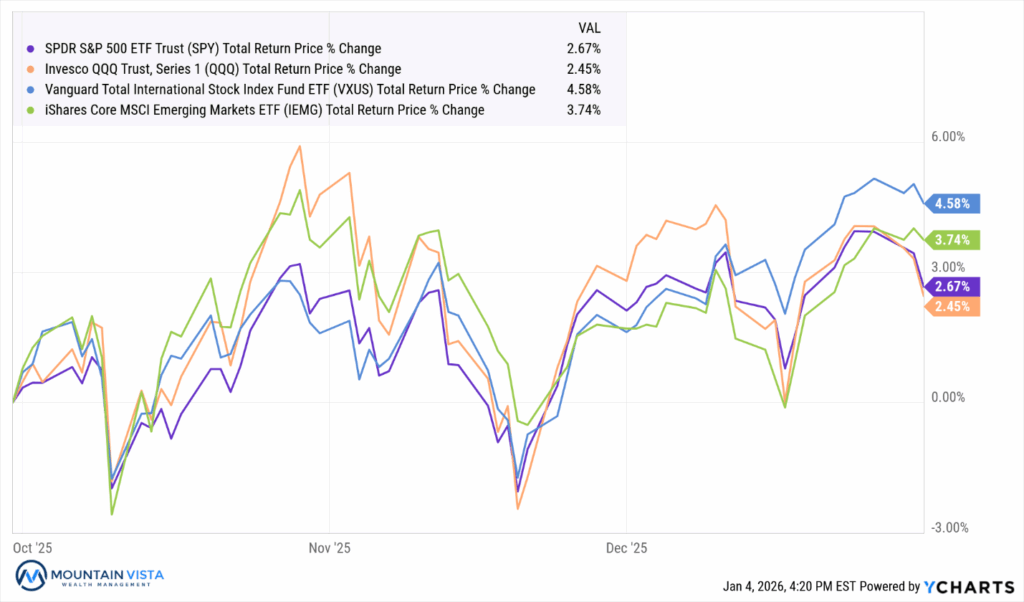
The fourth quarter presented a nuanced market environment characterized by significant rotation, bouts of volatility and divergence across asset classes. Domestic equity indices posted modest gains, with SPY (S&P 500 ETF) advancing 2.7% and QQQ (Nasdaq 100 ETF) rising 2.5%, while international markets demonstrated strength. VXUS (International Equity ETF) gained 4.6%. IVE (Value ETF) outperformed IVW (Growth ETF) for the quarter, returning 3.2% versus 2.2%.
Figure 1: U.S. Indices vs. International Equities
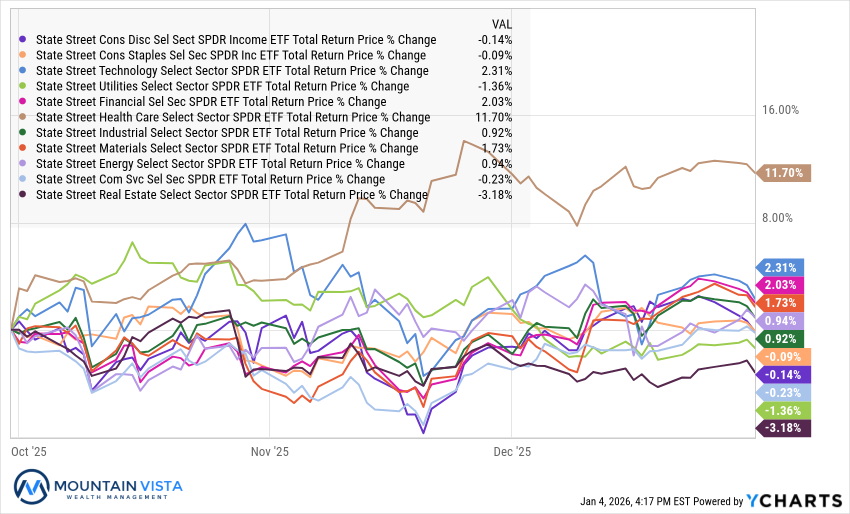
At the sector level, Q4 was dominated by XLV’s (Healthcare ETF) 11.7% surge, making it the quarter’s standout performer and helping it finish the year up 14.5%. In stark contrast, XLRE (Real Estate ETF) declined (-3.2%), XLU (Utilities ETF) fell (-1.4%), and XLP (Consumer Staples ETF) struggled with a (-0.1%) return. XLK (Technology ETF), despite gaining only 2.3% in the quarter, still finished 2025 up an impressive 24.6% thanks to its 60.9% surge from April onward.
Fixed income markets faced headwinds during the quarter, with AGG (Bloomberg Aggregate Bond ETF) gaining just 0.9% and TLT (20+-year U.S. Treasury ETF) declining (-1.0%), though both still posted respectable full-year returns of 7.2% and 4.2% respectively. JNK (High-yield Bond ETF) demonstrated resilience with a 1.4% quarterly gain, while EMB (EM Dollar Bonds ETF) was particularly strong, rising 2.8% in the quarter and delivering an impressive 13.9% for the full year.
Finally, in alternatives, GLD (Gold ETF) extended its remarkable run with an 11.5% gain, capping off an extraordinary 63.7% annual return that stands as one of the year’s most impressive performances across any major asset class. DBB (Base Metals ETF) also surged 14.7% in the quarter. On the other hand, cryptocurrencies reversed sharply after strong gains earlier in the year. In the 4th quarter, FBTC (Bitcoin ETF) and ETHA (Ethereum ETF) plunged 23.6% and 28.8%, respectively, turning both negative for the full year. USO (Oil ETF) also struggled, declining 6.2% in the quarter and finishing 2025 down 8.5%.
American’s Struggle with the “K-Shaped Economy”
It seems like every interview on CNBC or news article about the economy is referencing the “K-Shaped Economy”. Like the diverging diagonal lines of the letter “K”, the implication is that economic outcomes are progressively better for those at the top of the wealth distribution and more challenging for middle- and low-income households.
By traditional measures, the economy is thriving. Q3 2025 GDP came in at 4.3%, following a respectable reading of 3.8% in Q2. Furthermore, stock indices are near all-time highs. Why is there such a disconnect between the broad economic data and how so many Americans are feeling?
Reason #1: (Un)Affordability is a big problem
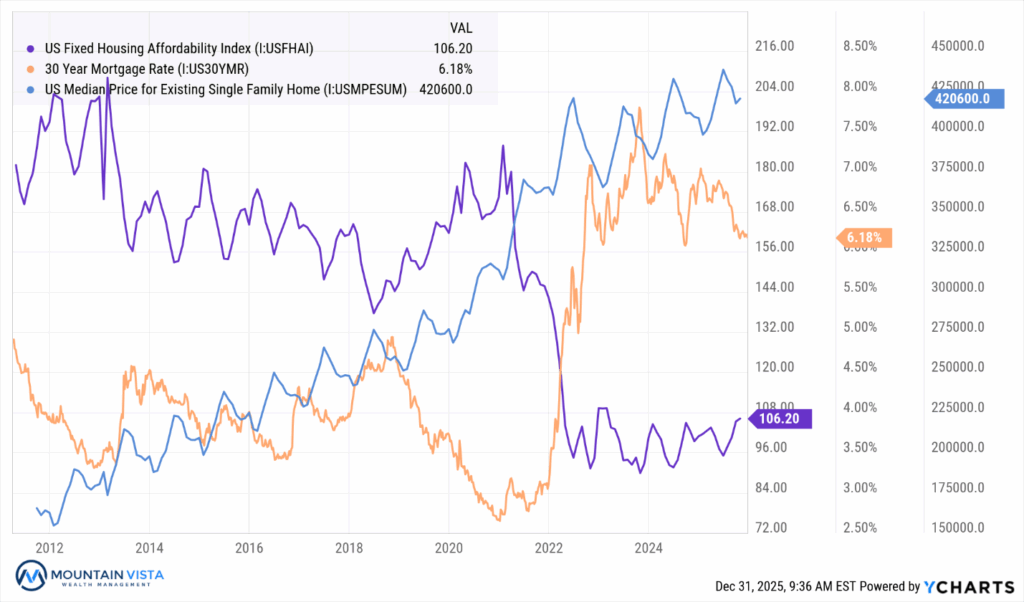
Many large ticket items, such as homes and automobiles, are typically bought using debt. High interest rates and persistently high prices have pushed up monthly payments up at a shocking rate relative to income growth. The cost to service an auto loan or mortgage has become prohibitively expensive for many. While mortgage rates have come off their highest levels, affordability remains stuck at levels reached in mid-2022.
Figure 2: U.S. Housing Affordability vs. Mortgage Rate and Median Home Price
Reason #2: The Housing Market is Stuck at Financial Crisis Level Activity
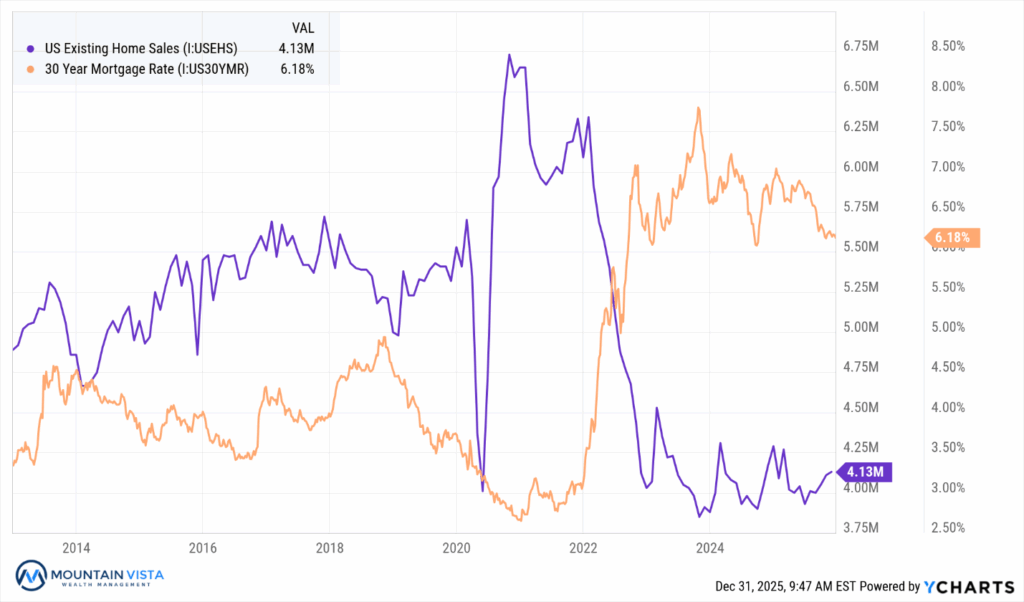
In response to poor affordability, U.S. Existing Home Sales have plummeted to levels last seen in the financial crisis (see Figure 3). The housing market is one of the most important sectors of the economy because of its direct and indirect effects on employment, consumption and financial stability. To build and sell a new home, we need materials, construction workers, realtors and mortgage brokers. Once the home is sold, the home needs to be furnished with TVs, furniture, paint, pots and pans, etc. Housing’s economic tentacles reach broadly through the economy.
Figure 3: Existing Home Sales vs. Mortgage Rate
Reason #3: Employment is at Stall Speed
Despite strong GDP growth, overall employment growth has been uncharacteristically weak. While it is unclear how much of the weakness in hiring is due to AI implementation, companies are and will continue to invest in technology that allows them to make their existing workforce more productive. This is good for corporate profit margins and stock prices. But the near-term implication is less job creation.
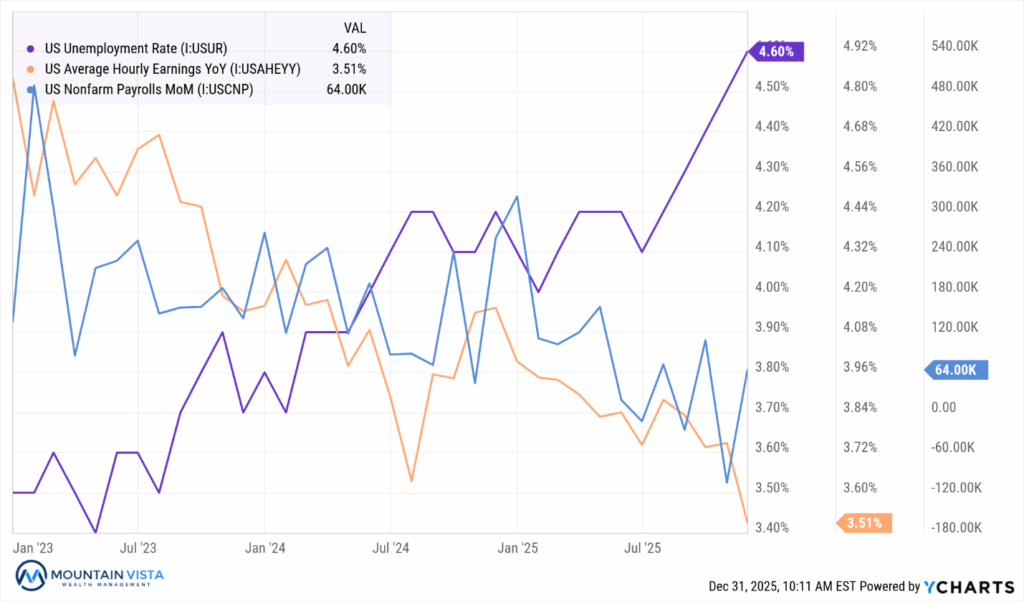
As you can see in Figure 4, unemployment has been increasing while earnings growth and monthly new payrolls continue to fall. Companies have slowed their hiring down to a stall speed that suggests that they are squeezing more output from their current employees. This is what an AI-driven productivity boom looks like. We must hope that new jobs will be created to employ the displaced workers.
Figure 4: U.S. Unemployment Rate, Average Hourly Earnings and Non-Farm Payrolls
Reason #4: Inflation is Still Too High
Finally, while inflation is showing signs of cooling on many fronts (gas, rent, groceries), tariffs have pushed up goods prices, causing inflation to remain persistently above the Federal Reserve’s stated 2% target. This is the 5th year in a row that inflation has been above the 2% level.
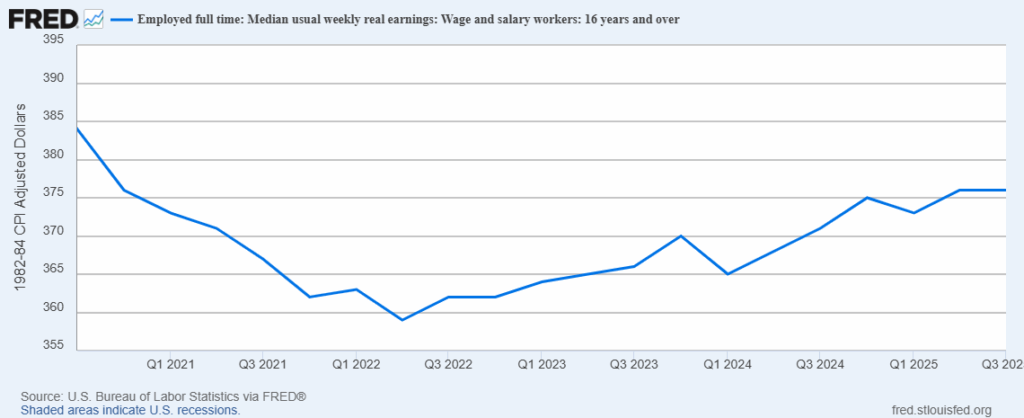
Even if inflation comes down to the 2% target, the sticker shock of overall price levels will weigh on sentiment for some time. We are unlikely to see a broad-based deflation in price levels, given the financial stability risk that would pose. As you can see in Figure 5, while real wage growth has been trending up since Q3 2022, overall real wages are still below 2020 levels, and the psychological scars of 2021/22 remain.
Figure 5: Median Weekly Real Earnings, Employed and Age 16+
In summary, the cost of the “American Dream” has become too expensive for many Americans. Years of high inflation, coupled with higher interest rates, have eroded affordability in the housing market and other items that rely on debt financing. At the same time, it has become more challenging to get a job and wage growth is falling quickly.
As it was in recent mayoral elections, affordability is expected to be the main talking point in the up-coming mid-term elections. Hopefully, there will be some thoughtful solutions to this very real problem facing our country.
Gold and “Digital Gold” Diverge Sharply in Q4 2025
Gold and Bitcoin, aka digital gold, diverged sharply in 2025, underscoring their fundamentally different roles within portfolios despite being grouped together as a hedge against monetary debasement. Gold delivered exceptional gains consistently as investors increasingly sought assets tied to real scarcity, long-standing monetary credibility, and low correlation to financial assets. Persistent geopolitical risk, elevated fiscal deficits, and a gradual erosion of confidence in fiat currencies supported sustained inflows into gold, particularly as central banks continued to be net buyers. The metal’s strong performance in both Q4 and the full year reflected its function as a defensive store of value during periods of macro uncertainty.
Figure 6: Total Returns of Gold and Bitcoin
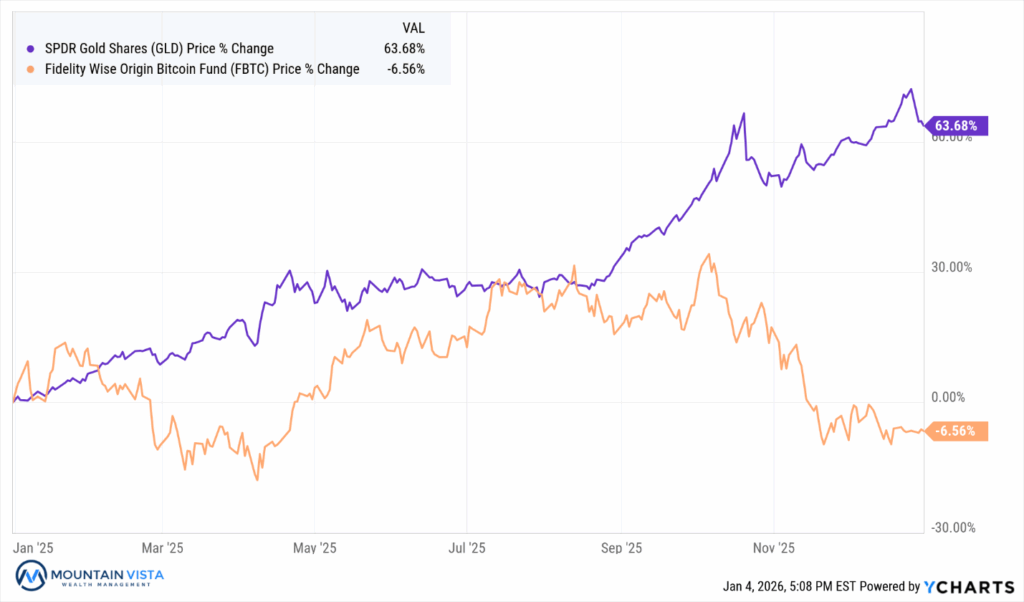
Bitcoin, by contrast, exhibited far greater volatility and a very different return profile. While it experienced powerful rallies earlier in the year, those gains proved fragile as risk appetite faded and liquidity conditions tightened into year-end. The sharp drawdown in the fourth quarter highlighted Bitcoin’s sensitivity to speculative positioning, leverage, and shifting investor sentiment. Rather than behaving as a defensive hedge, Bitcoin traded more like a high-beta risk asset, amplifying moves in broader markets and responding acutely to changes in financial conditions.
The divergence between gold and Bitcoin in 2025 reinforced the importance of understanding why an asset is owned, not just how it has performed historically. Gold functioned as a stabilizer, benefiting from uncertainty and a desire for capital preservation, while Bitcoin remained driven by adoption narratives, liquidity cycles, and momentum. For diversified portfolios, the year illustrated that gold and digital assets are not interchangeable, and that their behavior can meaningfully diverge depending on the macro environment, investor psychology, and stage of the market cycle.
A Divided FOMC Delivers a December Rate Cut
The FOMC delivered a widely expected 25 basis point rate cut, lowering the federal funds rate to a range of 3.50-3.75%. However, the meeting was notable for the degree of division among policymakers, with three dissents. Governor Miran preferred a 50-basis point cut, while Presidents Goolsbee and Schmid preferred no change. This marked one of the most divided committees in recent memory, reflecting genuine disagreement about the balance of risks facing the economy.
Also of note was the announcement that the Fed would begin purchasing shorter-term Treasury securities to maintain ample reserves in the banking sector. This injection of additional liquidity into the market was received as dovish. Particularly because it came sooner than many expected.
Figure 7: FOMC December Summary of Economic Projections
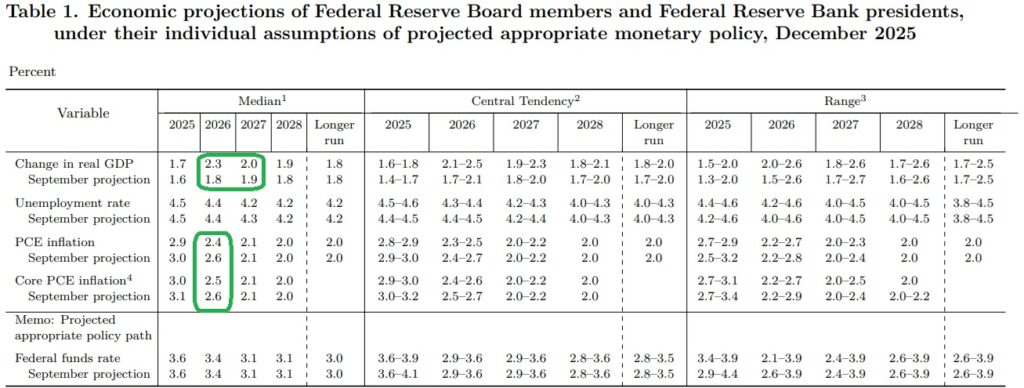
The newly released Summary of Economic Projections revealed an upgraded economic outlook that helped explain some of the year’s market strength. The median participant projected real GDP growth of 2.3% in 2026, a substantial upgrade from the 1.8% forecast in September, with Chair Powell attributing part of this increase to effects from the government shutdown shifting roughly 0.2% of GDP from late 2025 into early 2026. Core PCE inflation projections were lowered to 2.5% for 2026, down from 2.6% in September, while the unemployment rate forecasts remained largely stable around 4.2-4.3%. Importantly, the median projection for the federal funds rate remained unchanged at 3.4% for end-2026, suggesting only one additional 25 basis point cut over the coming year, though individual participant forecasts showed considerable dispersion.
Chair Powell’s press conference struck a notably dovish tone that markets interpreted as supportive despite the hawkish implications of a slower cutting path ahead. Powell emphasized that inflation had printed “somewhat below expectations in recent months” and presented what analysts characterized as a “relatively benign” inflation picture ahead, noting that excluding tariff effects, inflation was running in the “low 2% range.” He highlighted productivity growth as the key factor allowing higher near-term GDP growth above the long-run estimate while maintaining a benign inflation outlook.
Looking Forward
Several tailwinds support economic optimism as we enter the new year: a dovish Federal Reserve, OBBB-related tax refunds, a diminishing tariff shock, and moderating inflation. However, with the S&P 500 trading at a forward P/E of approximately 22, much of this optimism may already be priced in. We maintain a neutral stance on equities and are watching a few developing themes closely.
A key question for 2026 is whether AI investments will translate into measurable productivity gains and margin expansion beyond the technology sector. If this materializes meaningfully, we could see a healthy market broadening, alleviating concerns about data center buildout costs.
The downside scenario involves a reassessment of AI and data center ROI. Such a shift could trigger sharp corrections in high-flying growth stocks, particularly those dependent on sustained infrastructure spending or the uncertain future revenues of currently unprofitable ventures like OpenAI.
In fixed income, we hold a more constructive view. We expect inflation to continue its downward trajectory and anticipate the dovish faction will prevail within the Federal Reserve. Credit markets may experience periodic volatility as the private credit boom generates default headlines, but overall conditions appear favorable.
Gold and Bitcoin remain sensible portfolio diversifiers against fiat currency weakness and fiscal indiscipline across developed markets. Given gold’s substantial rally over the past two years, a correction or consolidation period would not be surprising.
We appreciate your review of this analysis and welcome any questions regarding these observations or other financial matters of interest. Happy new year! We wish you a happy, healthy and prosperous 2026.
APPENDIX
Equity Index ETF Total Return
| ETF | Description | Q4 2025 Total Return | Since April 8, 2025 | 2025 Total Return |
| SPY | S&P 500 | 2.7% | 38.5% | 17.7% |
| QQQ | Nasdaq 100 | 2.5% | 48.2% | 20.8% |
| IWM | Russell 2000 | 2.1% | 42.1% | 12.7% |
| IVW | S&P 500 Growth | 2.2% | 49.1% | 21.9% |
| IVE | S&P 500 Value | 3.2% | 27.6% | 13.0% |
| VXUS | International Ex-US | 4.6% | 40.0% | 32.3% |
| IEMG | Emerging Markets | 3.7% | 45.0% | 32.6% |
U.S. Equity Sector Total Return
| ETF | Description | Q4 2025 Total Return | Since April 8, 2025 | 2025 Total Return |
| XLV | Healthcare | 11.7% | 18.0% | 14.5% |
| IYZ | Telecom | 5.7% | 40.5% | 29.3% |
| XLK | Technology | 2.3% | 60.9% | 24.6% |
| XLF | Financials | 2.0% | 26.0% | 14.9% |
| XLB | Materials | 1.7% | 24.0% | 9.9% |
| XLE | Energy | 0.9% | 20.0% | 7.9% |
| XLI | Industrials | 0.9% | 34.7% | 19.3% |
| XLP | Consumer Staples | (0.1%) | 4.0% | 1.5% |
| XLY | Consumer Disc | (0.1%) | 36.2% | 7.4% |
| XLC | Communications | (0.2%) | 37.9% | 23.1% |
| XLU | Utilities | (1.4%) | 19.3% | 16.0% |
| XLRE | Real Estate | (3.2%) | 11.9% | 2.6% |
U.S. Equity Sector Total Return
Global Equity ETF Total Return
Fixed Income ETF Total Return
| ETF | Description | Q4 2025 Total Return | Since April 8, 2025 | 2025 Total Return |
| AGG | Aggregate Bond | 0.9% | 5.3% | 7.2% |
| BND | Total Bond Market | 0.9% | 5.2% | 7.1% |
| LQD | IG Corporate | 0.3% | 8.2% | 7.9% |
| JNK | HY Corporate | 1.4% | 11.9% | 8.8% |
| EMB | $ EM Bonds | 2.8% | 15.6% | 13.9% |
| SHY | 1-3 Yr Treasuries | 1.1% | 3.1% | 5.0% |
| IEF | 7-10 Yr Treasuries | 0.9% | 4.2% | 8.0% |
| TLT | 20+ Yr Treasuries | (1.0%) | 2.0% | 4.2% |
| TIP | TIPs | (0.1%) | 3.7% | 6.8% |
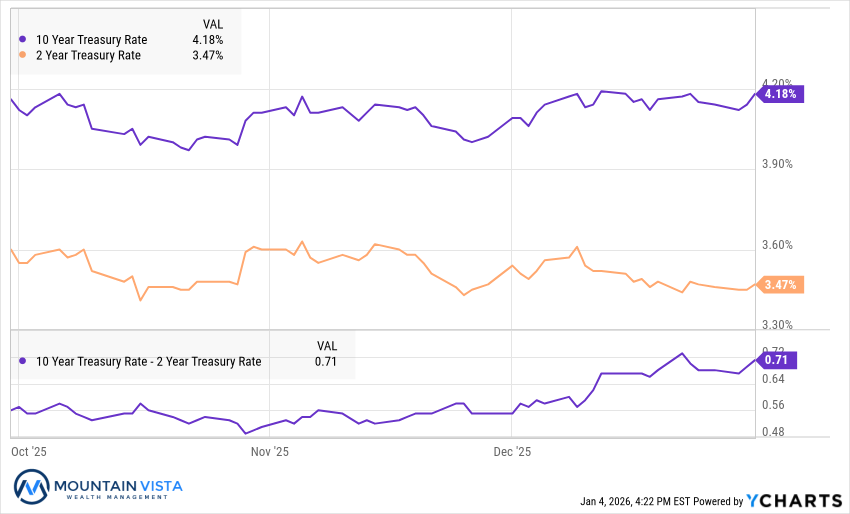
U.S. Treasury Yields and 2/10 Spread
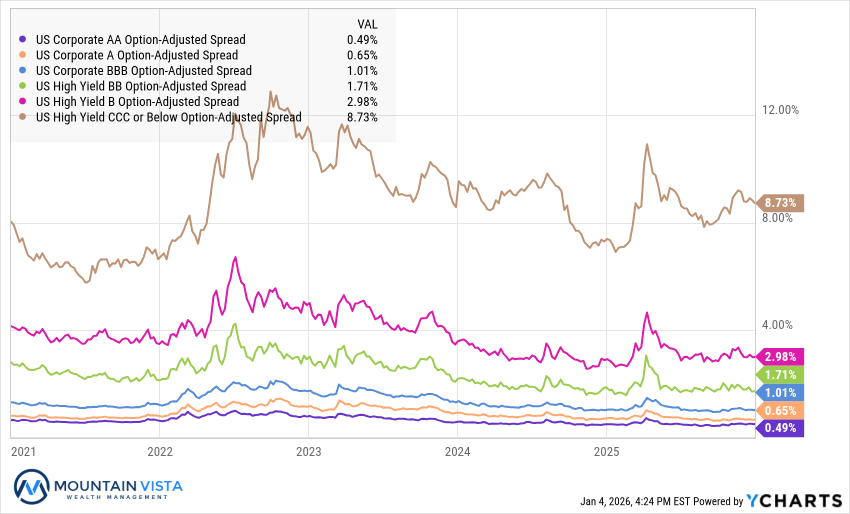
U.S. Corporate Credit Spreads
Commodity and Bitcoin Total Return
| ETF | Description | Q4 2025 Total Return | Since April 8, 2025 | 2025 Total Return |
| PDBC | Diversified Commodity | 2.5% | 12.7% | 6.0% |
| GLD | Gold | 11.5% | 44.0% | 63.7% |
| DBB | Base Metals | 14.7% | 36.8% | 25.0% |
| USO | Oil | (6.2%) | 9.2% | (8.5%) |
| FBTC | Bitcoin | (23.6%) | 13.8% | (6.6%) |
| ETHA | Ethereum | (28.8%) | 102.6% | (11.3%) |
Disclaimer
The views and opinions expressed are for informational and educational purposes only as of the date of writing and may change at any time based on market or other conditions and may not come to pass. This material is not intended to be relied upon as investment advice or recommendations, does not constitute a solicitation to buy or sell securities and should not be considered specific legal, investment or tax advice. The information provided does not take into account the specific objectives, financial situation, or particular needs of any specific person. All investments carry a certain degree of risk and there is no assurance that an investment will provide positive performance over any period of time. Equity investments are subject to market risk or the risk that stocks will decline in response to such factors as adverse company news or industry developments or a general economic decline. Debt or fixed income securities are subject to market risk, credit risk, interest rate risk, call risk, tax risk, political and economic risk, and income risk. As interest rates rise, bond prices fall. Non-investment-grade bonds involve heightened credit risk, liquidity risk, and potential for default. Foreign investing involves additional risks, including currency fluctuation, political and economic instability, lack of liquidity and differing legal and accounting standards. These risks are magnified in emerging markets. Past performance is no guarantee of future results.