
INTRODUCTION
As we close out the first half of 2018, we long for the market returns of 2017 when the S&P 500 returned 19.4% and the Barclays Aggregate returned 3.6%. Despite knowing that things would not continue to be so easy, it does not make it any less frustrating to see increased volatility in our portfolio value without the commensurate returns. That being said, we must remain focused on the long-term, preserving the purchasing power of our investment portfolios and seeking real returns. Eventually, this bout of indigestion will pass and prices will improve before we are confident that the coast is clear. We will remain calm, rebalance periodically, and eventually we will be rewarded for our discipline.
EQUITY MARKET
| ETF | Description | Price | 2018 Total Return | 2017 Total Return |
| SPY | S&P 500 | 272.5 | 2.5% | 21.7% |
| QQQ | Nasdaq 100 | 172.6 | 10.6% | 32.7% |
| IWM | Russell 2000 | 165.4 | 7.7% | 14.6% |
| IVW | S&P 500 Growth | 163.6 | 7.1% | 27.2% |
| IVE | S&P 500 Value | 110.6 | (2.4%) | 15.2% |
| VXUS | Total International Stock | 53.9 | (3.5%) | 27.5% |
| IEMG | Emerging Markets | 52.1 | (7.0%) | 37.4% |
After the blistering gains of 2017, returns have been mixed so far in 2018. Despite the pedestrian YTD returns, the S&P 500 has experienced a lot of volatility. In January, the S&P 500 was up over 7% before falling (10%) over the course of two weeks. The scapegoat for the correction is a rapid unwind of a crowded short volatility trade, but in reality, the market was due for some mean reversion after the gains of 2017 and quick start to 2018. While SPY is positive for the year, we are still 5% off of the YTD highs.
| ETF | Description | 2018 Total Return | ETF | Description | 2018 Total Return |
| XLY | Consumer Disc | 11.4% | XLB | Materials | (3.2%) |
| XLK | Technology | 9.4% | XLF | Financials | (4.0%) |
| XLE | Energy | 6.6% | XLI | Industrials | (4.6%) |
| XLV | Healthcare | 1.7% | IYZ | Telecom | (4.9%) |
| XLU | Utilities | 0.3% | XLP | Consumer Staple | (8.2%) |
At the sector level, there has also been a lot of return dispersion. Consumer discretionary, powered by Amazon’s 45% YTD gain, is up 11.4% YTD, while consumer staple stocks are down (8.2%). Ironically, the consumer staples sector is supposed to be a defensive sector that should benefit from the increase in risk aversion, but a combination of higher rates, taking the shine off of dividend payers, and a change in change in consumer preferences has challenged these stocks.
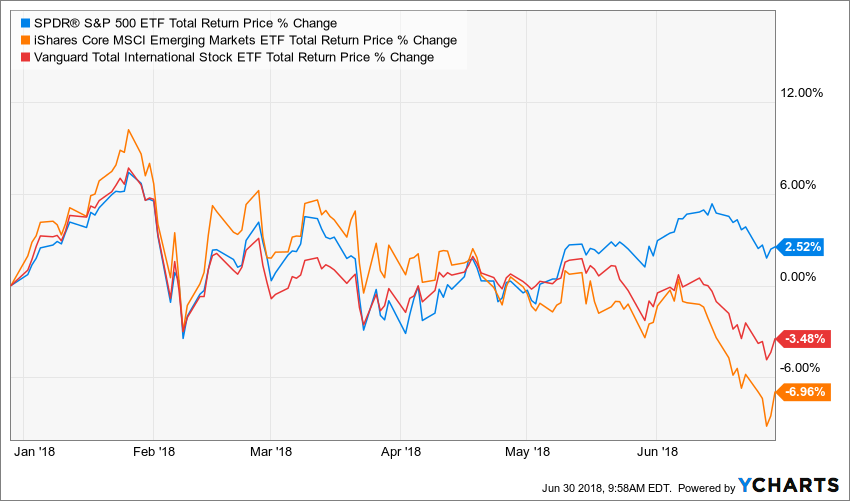
International and emerging market equities significantly outperformed in 2017, returning 27.5% and 37.4%, respectively. After holding up well versus the S&P 500 in Q1 2018, they have underperformed meaningfully in Q2 2018. IEMG outperformed SPY from January 1st, 2017 to January 26th, 2018 by approximately 20%. That outperformance was completely eliminated by June 28th, 2018.
The strength of the US dollar has historically been a headwind for EM economies as their USD denominated debts get costlier in local currency terms. But looking under IEMG’s proverbial hood, you will see that Asia is over 75% of geographical exposure. As trade rhetoric accelerated in Q2 2018, the underperformance IEMG also accelerated.
 In 2017, international and emerging markets benefited from a s
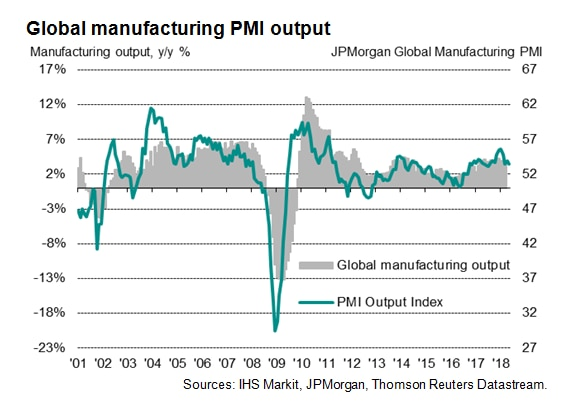 ynchronized global recovery. In 2018, we began to see cracks in that narrative. Global Manufacturing PMI data has dropped from levels recorded late last year. We have also seen a drop in the Global Economic Surprise Indexes, which suggests that actual economic data is no longer surprising to the upside versus expectations. That does not necessarily suggest the economies are rolling over, but it does suggest the good news is likely already reflected in market prices.
Finally, concerns re-emerged regarding the stability of the European Union after fears emerged that the populist political parties in Italy are gaining influence and may ultimately vote to leave the European Union. 10-year Italian debt quickly sold off and the spread versus the 10-year German debt increased from a low of 1.2% to over 2.4%. The situation has since stabilized, but with the European Central Bank trying to negotiate an exit from their bond purchase program, the risk for future market disruptions has increased.
FIXED INCOME MARKET
| ETF | Description | 2018 Total Return | ETF | Description | 2018 Total Return |
| AGG | Aggregate Bond | (1.6%) | SHY | 1-3 Yr Treasuries | 0.0% |
| BND | Total Bond Market | (1.6%) | IEF | 7-10 Yr Treasuries | (2.0%) |
| LQD | IG Corporate | (4.1%) | TLT | 20+ Yr Treasuries | (3.0%) |
| JNK | HY Corporate | (1.2%) | TIP | TIPs | (0.0%) |
| EMB | $ EM Bonds | (6.5%) |
 Fixed income has been challenged so far this year as the Federal Reserve has increased the Federal Funds Target Rate a total of 50 bps so far this year, with another one or two expected over the remainder of 2018. Larger deficits, increasing inflation, higher oil prices, and fiscal stimulus at a time when employment is increasingly tight have all biased interest rates to the upside. The European Central Bank is also taking steps to end their bond purchase program, which is adding additional pressure to long term interest rates globally.
All of that being said, the returns in US fixed income can hardly be called a disaster and the scenario that has been predicted by bond bears has not yet come to pass. AGG, which represents the broad US fixed income universe, is only down (1.6%) on a total return basis, while TLT is only down (3.0%). The biggest surprise is that High Yield is only down (1.2%) YTD.
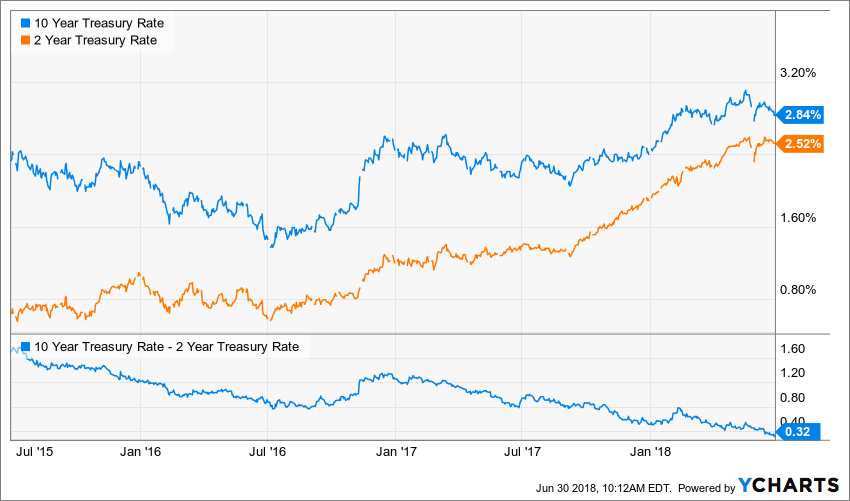
After climbing relentlessly since the end of last year, the 2-year treasury yield has leveled off at 2.5%. With trade concerns rising, expectations of growth over the next two years have come under pressure. Lower growth implies that the Federal Reserve may not be able to hike rates much more before the economy comes under pressure.
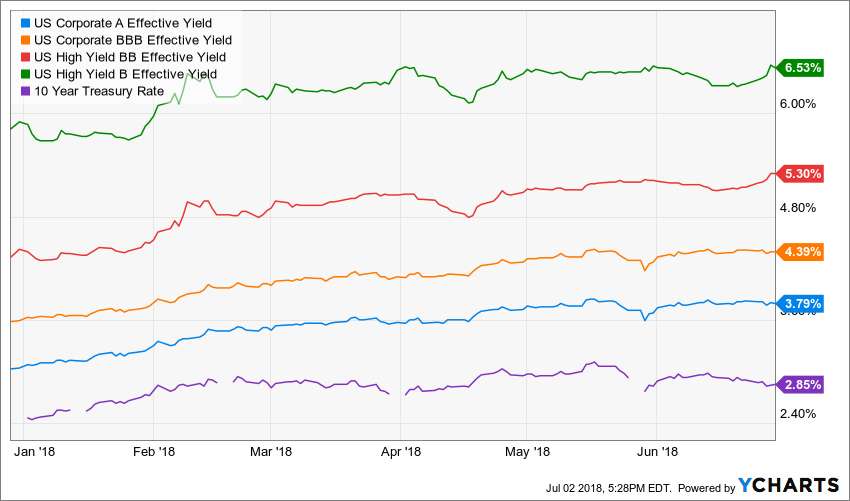
The credit markets have been reasonably resilient to what has been a tough market environment. With higher treasury rates, a tightening Fed, and increased equity volatility one would expect high yield spreads to be much wider. Bank of America reports that US High Yield B-rated Option-Adjusted Spread (“OAS”) is currently 3.82% versus 3.61% to start 2018. Bonds rated CCC or below have actually seen their OAS drop from 8.31% to 7.06%. JNK is down (1.7%) YTD on a total return basis and (3.9%) on a price basis.
Investment grade corporate debt has not fared as well. US Corporate A-rated OAS are currently 1.05% versus 0.76% to start the year. An increase of 38%. The lower spread levels on investment grade debt relative to high yield results in less income to offset movements in price. Also, the duration of investment grade debt tends to be longer than high yield, which results in more sensitivity to the level of interest rates. The widening of spreads and increase in treasury yields over the course of H1 2018 has left LQD down (4.4%) on a total return basis and (6.0%) on a price basis.
The outperformance of lower rated junk and stability of spread levels suggests that the market is not overly concerned about an increase in defaults due to a recession in the near term. The underperformance of investment grade debt is more of a reflection of an aversion to duration and pricing in higher rate volatility. LQD has an effective duration of 8.5 years; whereas JNK has an effective duration of 4.1 years. Duration measures the sensitivity of a bonds price to changes in interest rates.
CONCLUSION
The first half of 2018 saw a meaningful increase in volatility and the muted YTD return of the S&P 500 masks very divergent performance amongst sectors, geography, and asset classes. After such a strong performance in 2017, it is not too surprising that the market is suffering some indigestion this year. Whether this is the end of the bull market or just a period of consolidation will likely be determined by the strength of the economy and the Federal Reserve’s ability to manage inflation without dramatic increases in short term interest rates.
Our baseline view is that the Federal Reserve will proceed cautiously and will likely pause if financial conditions tighten too much. Their pivot to a more hawkish stance is a justified move given the pick up in inflation and tightening labor market. Asset price returns will likely be more muted in this environment, but equities will likely continue to perform if earnings growth remains robust.
As far as trade is concerned, we should not be surprised that the current administration has focused on making the US more competitive in international trade. The US is unlikely to back away without receiving some concessions from China and some tariffs are likely to get implemented, but comparisons to the Smoot-Hawley Tariff Act are overdone.
We remain focused on generating long term value for our clients and creating investment portfolios that will perform within their risk appetite. The market will not always go up, but it is important to keep a long-term focus and to ride out short term gyrations. We thank you for entrusting us with the responsibility of managing your portfolio and being a client of Mountain Vista.
Sincerely,

Jonathan R. Heagle
Disclaimer
The views and opinions expressed are for informational and educational purposes only as of the date of writing and may change at any time based on market or other conditions and may not come to pass. This material is not intended to be relied upon as investment advice or recommendations, does not constitute a solicitation to buy or sell securities and should not be considered specific legal, investment or tax advice. The information provided does not take into account the specific objectives, financial situation, or particular needs of any specific person. All investments carry a certain degree of risk and there is no assurance that an investment will provide positive performance over any period of time. Equity investments are subject to market risk or the risk that stocks will decline in response to such factors as adverse company news or industry developments or a general economic decline. Debt or fixed income securities are subject to market risk, credit risk, interest rate risk, call risk, tax risk, political and economic risk, and income risk. As interest rates rise, bond prices fall. Non-investment-grade bonds involve heightened credit risk, liquidity risk, and potential for default. Foreign investing involves additional risks, including currency fluctuation, political and economic instability, lack of liquidity and differing legal and accounting standards. These risks are magnified in emerging markets. Past performance is no guarantee of future results.