INTRODUCTION
There has been a lot of talk about how the structure of the financial market has changed in recent years. The size and magnitude of the correction and subsequent recovery of the equity market over the last few months reinforces that view. With financial data more readily available to the masses, social media, automated quantitative trading, and concentration of capital, it should be no surprise that the market is reacting more quickly to changing trends. In addition to these items, the reduction of proprietary trading at financial institutions, via the Volker Rule, has decreased the ability of those banks to act as a liquidity provider. Less liquidity results in more severe drops and spikes in asset prices when the number of buyers and sellers is out of balance.
As an investor, it is not pleasant to see a large percentage of your holdings evaporate so quickly, but rather than viewing this as a risk to the system, it should be viewed as an opportunity to be more tactical with your investments. By increasing cash allocations when times are good, we can cushion ourselves from the periodic routes and take advantage of those bargain prices.
We construct our clients’ portfolios with the understanding that market corrections and recessions happen. The key to successful long-term investing is making sure the losses during these periods is not more than the client can sustain. The liquidation of a portfolio during a correction can evaporate years of gains and should be avoided at all costs.
Finally, a special thanks to all of our clients for their continued support. We remain focused on delivering long-term investment returns, while taking into account our clients’ goals and risk tolerance. As always, we are available to discuss any questions or concerns that you may have.
Sincerely,

Jonathan R. Heagle
President and CIO
OVERALL MARKET COMMENTARY
What a difference a few months can make. At the close of 2018, investors were worried that we were heading into a recession, driven by a hawkish Federal Reserve and an unresolved trade war with China. The S&P 500 was down 20% from its October highs and previously high-flying stocks were down much more than that. It was a scary time, but in hindsight it was an overreaction.
One of the primary causes of the correction, namely an overly hawkish Federal Reserve, was reversed with a few supportive words from Federal Reserve Chairman, Jerome Powell in January 2019. At the March meeting, the Fed revised their projection of future rate hikes so that the median showed no more hikes in 2019. They also announced their intention to end quantitative tightening in September. The market has celebrated this pivot to a more supportive Federal Policy. Since Christmas Eve, the S&P 500 and NASDAQ Composite have returned over 20% and 25%, respectively and sit within a few percentage points of their all-time highs.
Despite recovering nearly all of the losses from the correction, the economy is showing clear signs of slowing down. US Non-farm Payrolls showed a growth of only 20K in February. This is the second lowest result since 2010. This weakness did not show up in the ADP jobs report, so it may get revised away. Also, US Real GDP growth continued to slow down from its peak of 4.2% QoQ to 2.6% in the 4th quarter of 2018. This should be expected as the boost from last year’s tax cuts wears off, but the negative rate of change is not comforting. Finally, housing data has been downright ugly. Existing home sales are down 14% from their 2017 peak, median home price growth is down from 7.7% in February 2018 to 5.61% in January 2019, and the supply of homes for sale has increased from under 5 months to 6.6 months. Some of this weakness will be relieved by the drop in long-term interest rates, but with affordability stretched, it is possible that we have seen the peak in housing data for this economic cycle.
The housing sector is of vital importance to the economy. It encompasses the investment in new construction, the workers who build the houses, commissions paid to realtors, rehabilitation expenditures by flippers, home furnishing purchased by new home buyers, mortgage origination fees and so much more. Finally, the home is typically a household’s single greatest asset, so a drop in its value can have meaningful psychological and financial effects on the homeowner. A sustained weakness in the housing sector would be a major drag on the economy.
Going forward we will be watching the economy closely. The correction in the 4th quarter of 2018 proved to be an overreaction, but the economy is showing signs of slowing down. It is very possible that we have seen the last hike in short-term interest rates for this cycle, assuming there is no meaningful change to fiscal policy or a large change in another monetary policy tool. The best way to operate in this market is to keep allocations close to neutral and wait for the market to present opportunities.
EQUITY MARKET
Figure 1: Equity Index ETF Returns
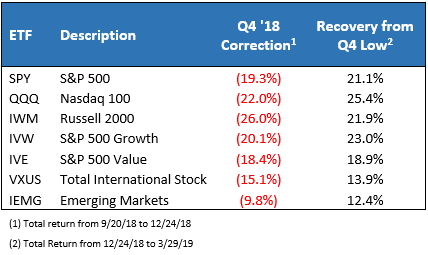
SPY (S&P 500 ETF) dropped by more than 20% on an intraday basis in the 4th quarter of 2018. While it didn’t technically close below the arbitrary 20% threshold to officially signal a bear market, much like the 2011 correction, I believe this qualifies in spirit. Since the low close on 12/24, SPY has returned over 21% on a total return basis. While we are still 2% away from the highs, that is a remarkable recovery.
The recovery began on a technical bounce as year-end selling was exhausted, but was then sustained by dovish rhetoric from the Federal Reserve. Notably, they announced that they were in “wait and see” mode on further interest rate hikes and signaled that the balance sheet reductions, or “QT”, may end sooner than they previously stated. At the March meeting, the Fed Governors went a step further revising their median rate projections to show no further rate hikes in 2019. Effectively, the Fed’s actions have reinstated the “Fed Put”, a phrase used to describe the belief that the Federal Reserve will ease monetary policy to stem equity market declines, thus limiting the downside risk.
While the QQQ (NASDAQ ETF) has recovered most of its losses, it is interesting to note that some of the larger names, such as AMZN, AAPL and NFLX, are still down over 10% from their 2018 highs. Also, small capitalization stocks (IWM) have also lagged when compared to the losses suffered in 2018. Small capitalization stocks tend to be more sensitive to growth in the U.S. economy, so they have been more effected by the downshift in domestic growth expectations.
Figure 2: Equity Sector Returns
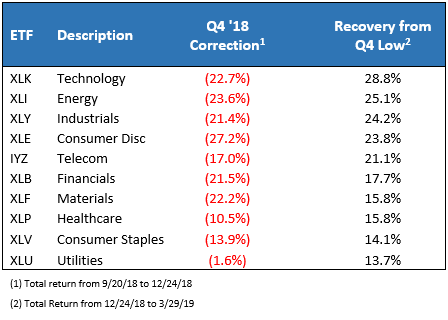
For the most part, the best performing sectors of 2019 have been the sectors that had the largest losses in late 2018. XLK (Tech Sector ETF) and XLI (Industrial Sector ETF) have been the top performers since the 12/24 low, with total returns of 29% and 25%, respectively. On the other side of the spectrum, XLU (Utilities Sector ETF) and XLV (Healthcare Sector ETF) have lagged the overall market with total returns of 14%.
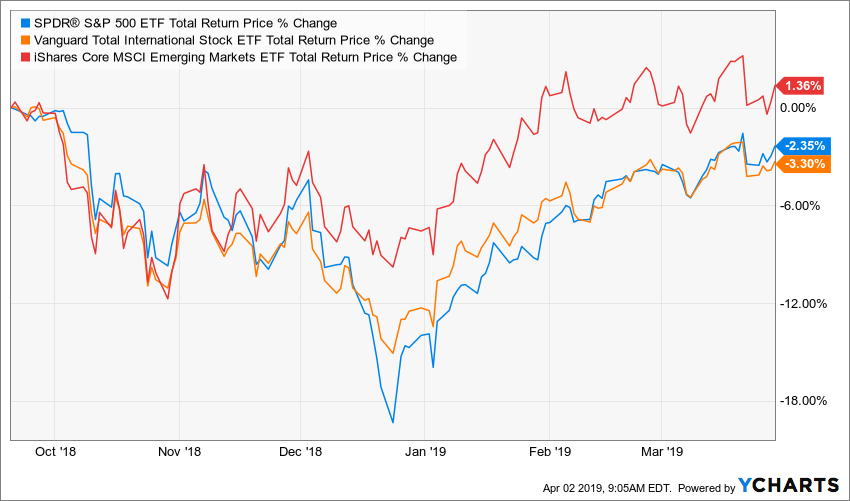
Finally, while IEMG (Emerging Market ETF) has not kept pace with the gains of SPY, it has recovered all of its losses from the broad market sell-off that began in the 4th quarter of 2018 (Figure 3).
Figure 3: Global Equity Returns since 9/20/2018
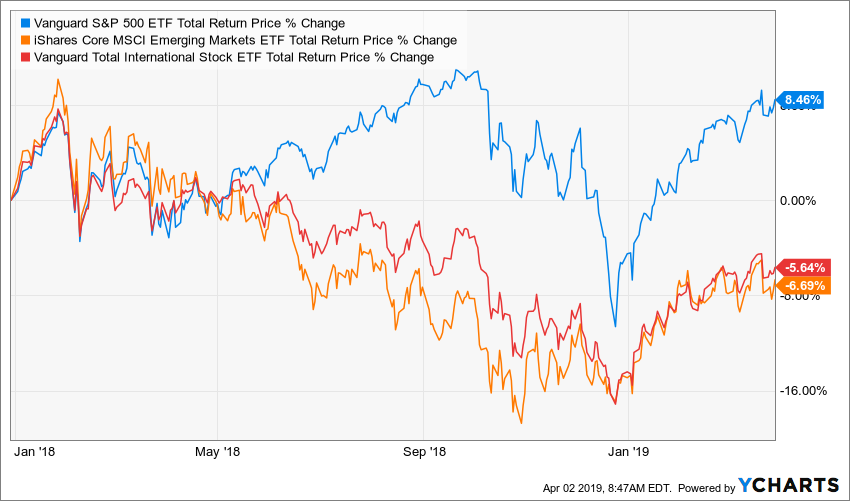
As you can see in Figure 4, despite outperforming both SPY (S&P 500 ETF) and VXUS (Total International Stock ETF) during the sell-off, IEMG (Emerging Market ETF) remains well below its early 2018 high. We believe emerging market equities have the potential to outperform domestic equities as the performance gap continues to compress.
Figure 4: Global Equity Market Returns since 1/1/2018
FIXED INCOME MARKET
Figure 5: Fixed Income Returns
Weakening economic data, scarce inflation, lower economic growth expectations, and a dovish Federal Reserve have combined to create a strong environment for fixed income. As you can see in Figure 5 above, every corner of the fixed income universe, with the exception of short-term treasuries, has recovered their losses from 2018. We were adamant that calls for the 10-year treasury yield to hit 4+% were not realistic, given the impact higher yields would have on the economy. We were proven correct in the 4th quarter of 2018 and the likelihood of meaningfully higher long-term rates in 2019 looks increasingly unlikely as the economy is slowing down.
LQD (Investment Grade Corporate Bond ETF) and JNK (High Yield Corporate Bond ETF) have been the top domestic performers with YTD total returns of 6.2% and 8.1%, respectively. EMB (Dollar-Denominated Emerging Market Bond ETF) has also performed well, with a total return of 6.8%. Lower rates have historically been supportive of EM bonds, so we would not be surprised to see EM perform strongly, absent a recession.
Figure 6: U.S. Treasury Yields
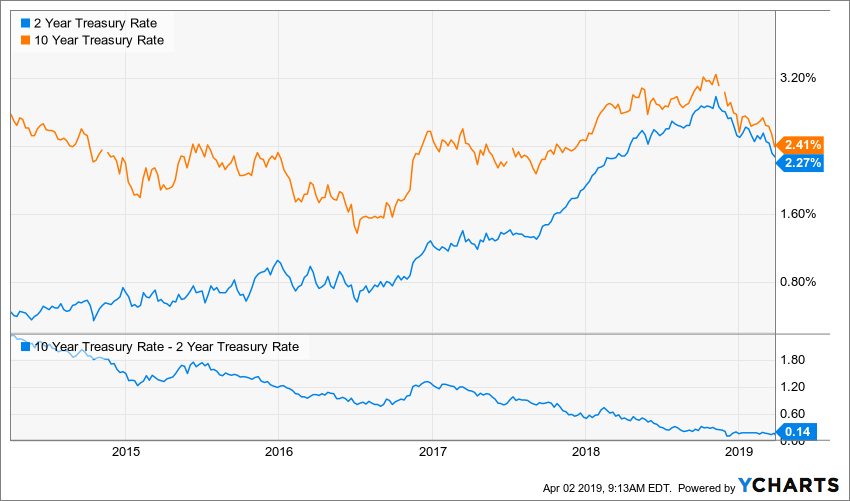
The 10-year treasury rate peaked at ~3.25% in November 2018 and has quickly dropped over 80 bps to 2.41%. The speed of the drop has silenced any of the remaining bond bears who have been calling for significantly higher long-term rates.
Since our last investor letter, the spread between the 10-year and 2-year treasury rates continues to decrease. At the end of 2018, the spread was 20 bps and it has since fallen to 14 bps. This indicator is commonly tracked as an indicator of a coming recession. In a world of significantly lower rates and a compressed term premium in the treasury market, I would not be surprised if the indicator proved to be less reliant than in the past. Finally, it should be noted that the spread between the 2-year and 5-year treasury has actually gone negative and ended the quarter at negative 4 bps. This resulted in a brief hysteria in the financial media, but the noise quickly dissipated.
Figure 7: U.S. Corporate Credit Spreads
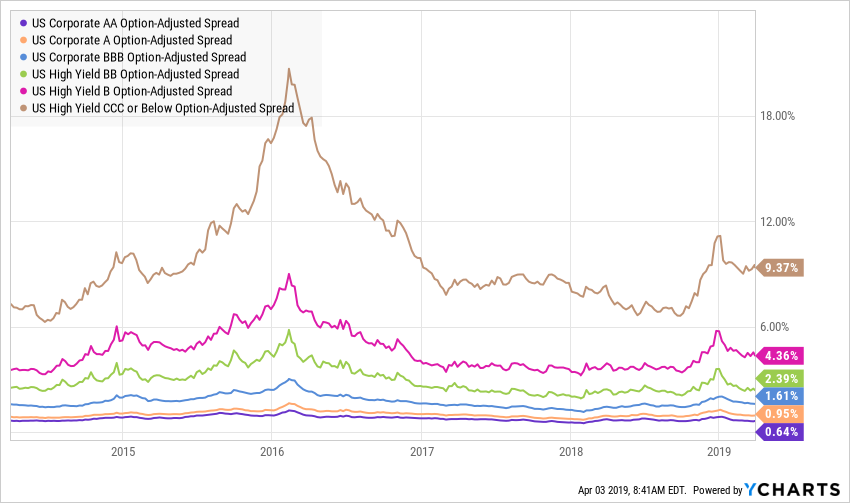
Corporate credit spreads posted a major turnaround in the 1st quarter of 2019. Coupled with falling treasury rates, yields on both High Yield and Investment Grade corporate debt have fallen meaningfully. The 5-year treasury rate has fallen over 30 bps over the quarter, while spreads on CCC or Below rated debt have fallen by 180 bps, resulting in over a 200 bps drop in total yield. As a result of lower yields, JNK (High Yield ETF) has returned over 8% in the first quarter.
As we mentioned in our last letter, we were watching credit spreads closely and were more concerned about their precipitous rise than the small inversion in parts of the treasury curve. With the Federal Reserve becoming more patient, in an attempt to combat financial instability and to support inflation expectations, it appears that the worst may be behind us. That being said, if the economy does not respond to the change in tone, spreads could start in increase again as credit investors price in a higher risk of recession.
CONCLUSION
The last two quarters were a terrific example of why our process works. By tailoring our clients’ portfolios to their risk tolerance and keeping our focus on long-term value creation, our clients were able to navigate the choppy waters in the 4th quarter of 2018 and realize the subsequent recovery in the 1st quarter of 2019. An investor that was overexposed heading into the 4th quarter may not have had the fortitude to ride out the downdraft in equity markets and would have lost years of returns by selling at depressed prices.
Over the long-term, we continue to believe that equities are the best source of real returns, but in the current environment we believe that a slightly defensive posture is warranted. To the extent that the Federal Reserve becomes more accommodative, we will respond accordingly.
Our focus is long-term value creation for our clients and creating investment portfolios that will perform within their risk appetite. The market will not always go up, but it is important to keep your eyes on the horizon and to ride out the short-term gyrations. We thank you for entrusting us with the responsibility of managing your portfolio and being a client of Mountain Vista.
Disclaimer
The views and opinions expressed are for informational and educational purposes only as of the date of writing and may change at any time based on market or other conditions and may not come to pass. This material is not intended to be relied upon as investment advice or recommendations, does not constitute a solicitation to buy or sell securities and should not be considered specific legal, investment or tax advice. The information provided does not take into account the specific objectives, financial situation, or particular needs of any specific person. All investments carry a certain degree of risk and there is no assurance that an investment will provide positive performance over any period of time. Equity investments are subject to market risk or the risk that stocks will decline in response to such factors as adverse company news or industry developments or a general economic decline. Debt or fixed income securities are subject to market risk, credit risk, interest rate risk, call risk, tax risk, political and economic risk, and income risk. As interest rates rise, bond prices fall. Non-investment-grade bonds involve heightened credit risk, liquidity risk, and potential for default. Foreign investing involves additional risks, including currency fluctuation, political and economic instability, lack of liquidity and differing legal and accounting standards. These risks are magnified in emerging markets. Past performance is no guarantee of future results.
