 INTRODUCTION
“Your success in investing will depend in part on your character and guts and in part on your ability to realize, at the height of ebullience and the depth of despair alike, that this too, shall pass.” – Jack Bogle
Before delving into the dramatic market moves that we have experienced over the last two months, we would first like to acknowledge the significant toll that the COVID-19 virus has inflicted upon our lives. At the time of this note, the United States’ death toll has just passed China and appears poised to increase dramatically in the coming weeks and months.
The most fortunate of us have only lost money and had our daily routines disrupted. For those that have lost their jobs, health or loved ones, we are truly sorry and urge you to reach out to us if there is any way that we can help you through this difficult period.
Upon waking up to the fact that COVID-19 was not just a foreign problem, the U.S. stock market experienced the fastest drop into a bear market in history, along with unprecedented levels of volatility. While our portfolios were certainly not immune to the price drops, we were underweight equities and quickly increased cash positions to their limit. This positioning allows us to focus on playing offense while others are rushing for the exit.
While the last few days of March provided a much-needed respite from the relentless price drops, those gains are probably temporary and volatility is likely to rear its head as the full impact of the virus is felt on the economy. Until we see a dramatic decline in new infections, a medical solution or much lower prices, we don’t believe we are out of the woods.
While this economic and market environment are unprecedented, and the emotional trauma will be long-lasting, we are confident that stock prices will ultimately recover; just as they have after every other major crisis in history. For those with the mental fortitude and patience to wait out the inevitable recovery, this is an opportunistic time to invest.
Thank you to all of our clients for your continued support during these difficult times. Please stay safe and healthy.
Sincerely,

Jonathan R. Heagle
President and CIO
OVERALL MARKET COMMENTARY
Entering 2020, the market appeared poised for further gains. The Federal Reserve was easing policy, the economy was slowing, but still growing, unemployment was negligible and the Presidential election was still months away. The coronavirus was percolating in China, but the messaging out of the leadership in China and the United States was that the situation was under control. In hindsight, the situation was anything but under control.
The market’s complacency quickly turned into panic as people around the world began falling ill and it was clear that the COVID-19 virus was being transmitted human-to-human and undetected for weeks. What started as a localized problem in Wuhan, China, exploded into a global pandemic with almost 1 million cases worldwide at the time of this commentary. Unfortunately, the number of cases and deaths is poised to rise materially over the near-term.
In an attempt to contain the virus, a federal mandate was issued that all non-essential businesses remain closed through at least April 30th. The population at large is being told to stay home and practice “social distancing”. While these practices are vital to managing the growth of new infections and maximizing our limited medical resources, the economic damage is very significant. 2nd Quarter 2020 economic data is difficult to predict, but there are projections of a (-34%) annualized contraction in GDP and 15% unemployment.
In early March, Saudi Arabia announced unexpected price discounts on their oil sales to Europe, Asia and the United States. This had the effect of starting a price war with Russia and causing the price of oil to plummet. This year, WTI Crude has fallen from approximately $63/barrel to $20/barrel, putting additional pressure on domestic energy companies. The unfortunate consequence will be layoffs and debt defaults.
The S&P 500 index entered a bear market, defined as a drop of (-20%), in less than a month. The index continued to drop, closing a much as (-34%) off of its February 19th high on March 23rd. The VIX index, which measures the market’s expectation of volatility, reached a high of 82 in March. For context, the highest close during the Financial Crisis, back in 2008, was 67. Credit spreads, which measure default risk on corporate bonds, spiked to levels not seen since 2009.
In an attempt to support the economy, the financial system and Americans, generally speaking, the Federal Reserve and U.S. government have acted quickly and in an unprecedented magnitude. The Federal government passed a bipartisan $2.2 trillion fiscal stimulus package that provides loans and assistance to small businesses, direct cash payments to most Americans, aid to the healthcare system and support to state and local governments. For context, the fiscal stimulus package enacted in 2009 was only $789 million.
On the monetary policy front, the Federal Reserve lowered the target Fed Funds rate (-1.5%) to 0.25% and reinstated QE purchases of at least $700 billion ($500 billion in U.S. Treasuries, $200 billion agency mortgage-backed securities), in addition to creating a variety of new facilities to support a broad range of private debt markets. The actions are too numerous to list in full, so please visit https://www.federalreserve.gov/newsevents/pressreleases/ for the full detail of the actions taken. The effect of these policies is to improve liquidity to the debt markets, suppress credit spreads and increase lending to the real economy.
Regardless of one’s view of how the virus was handled at its inception, since becoming a pandemic, the coordinated efforts of both branches of government have been reassuring. The quick passing of the largest bipartisan bill in our history as a country, shows that both parties realize the gravity of the situation. Unfortunately, if the economy remains shut down for more than a few months, these actions may prove inadequate. Hopefully, our representatives will continue to put the well-being of the country above their individual agendas.
EQUITY MARKET
Figure 1: Equity Index ETF Returns
| ETF | Description | Q1 2020 Total Return | From Peak 2/19 to 3/31 |
| SPY | S&P 500 | (19.4%) | (23.4%) |
| QQQ | Nasdaq 100 | (10.3%) | (19.5%) |
| IWM | Russell 2000 | (30.6%) | (31.8%) |
| IVW | S&P 500 Growth | (14.5%) | (21.4%) |
| IVE | S&P 500 Value | (25.3%) | (26.0%) |
| VXUS | International Ex-US | (24.4%) | (23.9%) |
| IEMG | Emerging Markets | (24.7%) | (23.7%) |
After a strong start to the year, with SPY (S&P 500 ETF) up almost 5% on February 19th, the equity market had its fastest drop into a bear market, or a (-20%) decline, on record. It took only 16 trading days for the S&P 500 index to fall (-27%). The market would continue to fall, trading lower by nearly (-34%) before recovering over the last week of the quarter.
Small capitalization stocks meaningfully underperformed large capitalization stocks. IWM (Russell 2000 ETF) declined (-30.6%) in Q1 2020, (-11.2%) worse than SPY (S&P 500 ETF).
One may have expected value to outperform growth in this environment, but IVE (S&P 500 Value) declined (-25.3%) versus a (-14.5%) decline for IVW (S&P 500 Growth), resulting in an underperformance of (-10.8%). While this result seems counterintuitive on its surface, it makes more sense when you consider that IVW (S&P 500 Growth) has a higher ownership of technology stocks, which are more likely to benefit from a work-from-home economy, while IVE (S&P 500 Value) has a higher exposure to energy and financial services, which are two of the worst performing sectors this quarter.
International stocks underperformed U.S. large cap stocks, but were in-line with VTI (U.S. Total Market ETF). In Q1 2020, VXUS (International ETF) and IEMG (Emerging Market ETF) declined by (-24.4%) and (-24.7%), respectively. With the strength of the U.S. dollar and weakness in oil, it is somewhat surprising that international and emerging market stocks did not underperform by a wider margin. This is likely due to their relative cheapness to domestic stocks prior to the sell-off.
We were generally underweight equities and overweight cash and fixed income coming into this correction. We quickly raised additional cash in the early phases of the sell-off, to reduce volatility and provide funds for opportunistic purchases. We managed to avoid the hardest hit sectors, cutting our losses very early on XLE (Energy Sector ETF) in February. Over the next few months, we expect to rebalance portfolios back to a neutral equity weight at lower prices or after some of the economic uncertainty dissipates.
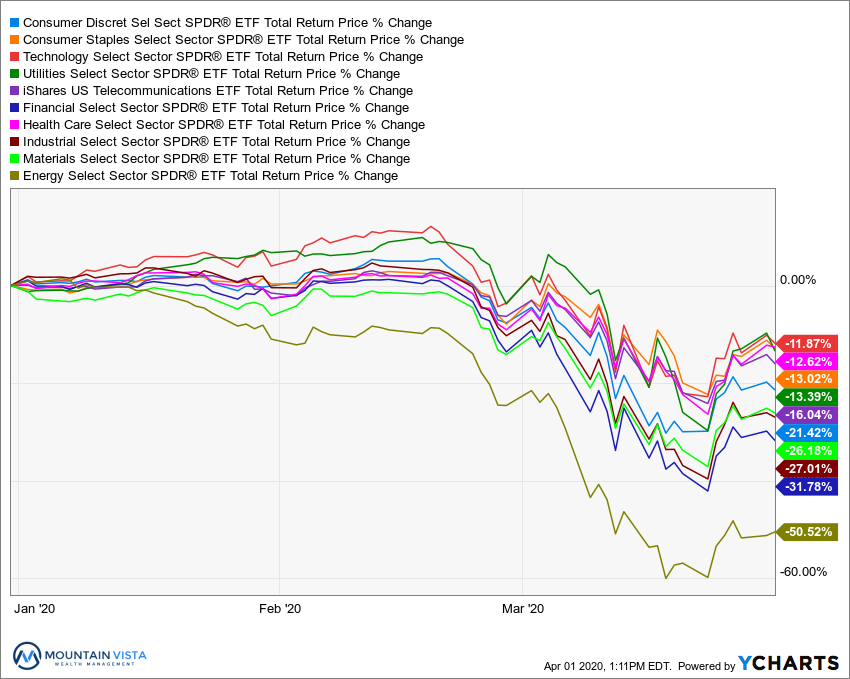
Figure 2: Equity Sector Returns
| ETF | Description | Q1 2020 Total Return | From Peak 2/19 to 3/31 | |
| XLK | Technology | (11.9%) | (21.4%) | |
| XLV | Healthcare | (12.6%) | (14.4%) | |
| XLP | Consumer Staples | (13.0%) | (15.1%) | |
| XLU | Utilities | (13.4%) | (20.3%) | |
| IYZ | Telecom | (16.0%) | (18.3%) | |
| XLY | Consumer Disc | (21.4%) | (25.5%) | |
| XLB | Materials | (26.2%) | (25.1%) | |
| XLI | Industrials | (27.0%) | (29.3%) | |
| XLF | Financials | (31.8%) | (32.6%) | |
| XLE | Energy | (50.5%) | (45.8%) |
It is not surprising to see low beta, defensive sectors as the best performers over the last quarter, but it is somewhat unexpected that technology is the top performer in a risk-off market. XLK (Technology Sector ETF) declined (-11.9%) in Q1 2020, with XLV (Healthcare Sector ETF), XLP (Consumer Staples ETF) and XLU (Utilities Sector ETF) all clustered around (-13%). Given the importance of digital solutions to our lives in a post-COVID-19 world, many technology stocks have performed relatively well.
XLE (Energy Sector ETF) and XLF (Financial Sector ETF) were the worst performing sectors with total returns of (-50.5%) and (-31.8%), respectively. Energy stocks have suffered not only from the COVID-19 induced recession, but were further impacted by the price war between Saudi Arabia and Russia. Financials are suffering from lower yields, higher future credit losses and declines in the price of their financial holdings.
Over the 1st quarter, we exited most sector positions, with the exception of consumer staples, consumer discretionary and utilities. We expect this defensive positioning to change over the next quarter as we prepare for a potential recovery.
Figure 3: Equity Sector Quarterly Total Return
FIXED INCOME MARKET
Figure 4: Fixed Income Returns
| ETF | Description | Q1 2020 Total Return | 2019 Total Return | |
| AGG | Aggregate Bond | 3.1% | 8.5% | |
| BND | Total Bond Market | 2.2% | 8.8% | |
| LQD | IG Corporate | (3.0%) | 17.4% | |
| JNK | HY Corporate | (12.7%) | 14.9% | |
| EMB | $ EM Bonds | (15.0%) | 15.5% | |
| SHY | 1-3 Yr Treasuries | 2.7% | 3.4% | |
| IEF | 7-10 Yr Treasuries | 10.5% | 8.0% | |
| TLT | 20+ Yr Treasuries | 22.1% | 14.1% | |
| TIP | TIPs | 1.3% | 8.3% |
Expectations of the likely recession have driven growth and inflation expectations much lower. Those expectations, coupled with investors’ typical “flight-to-quality” during market panics, have driven yields on treasuries down. TLT (20+ Year U.S. Treasury ETF) generated a total return of 22.1% over Q1 2020. AGG (Aggregate U.S. Bond ETF) only realized a 3.1% return over the quarter, despite the 122 bps fall in the yield on the 10-year U.S Treasury bond. Based upon duration alone, the return should have been closer to 6%. Dragging down performance was the ETF’s exposure to corporate and securitized bonds.
Credit sensitive sectors underperformed treasuries by a substantial margin. Yields on these bonds increased, despite the drop in risk-free U.S. Treasuries. In times of economic weakness, investors demand a higher risk premium to compensate them for increased risk of default. EMB (USD Emerging Market Bond ETF) and JNK (High Yield Corporate ETF) realized losses of (-15.0%) and (-12.7%), respectively.
While the drop in High Yield and Emerging Market bonds is understandable in the current environment. The movement of LQD (Investment Grade Corporate ETF) over the quarter was surprising. At the height of the market’s decline, LQD was down nearly (-22%) from its peak. On-the-one-hand, this can simply be written off as a market dislocation driven by panic selling, but it could also be an indication of something more nefarious lurking beneath the surface. Roughly half of the bonds in this ETF are rated BBB, which is only one downgrade away from being reclassified as a high yield bond. If these bonds are downgraded due to economic fallout, funds that are mandated to hold investment grade bonds would need to sell these “fallen angels” to a buyer with a much higher return target.
With yields on U.S Treasury bonds trading at such low levels, we see limited upside. While yields could fall further on prolonged economic deterioration, there is also risk that yields could jump higher after the economy reopens. Also, for the reasons stated above, we are concerned about downgrades of investment grade corporate bonds and we have reduced our exposure to the sector. We are constructive on agency mortgage-backed securities and prefer to hold higher levels of cash until yields increase.
Figure 5: U.S. Treasury Yields
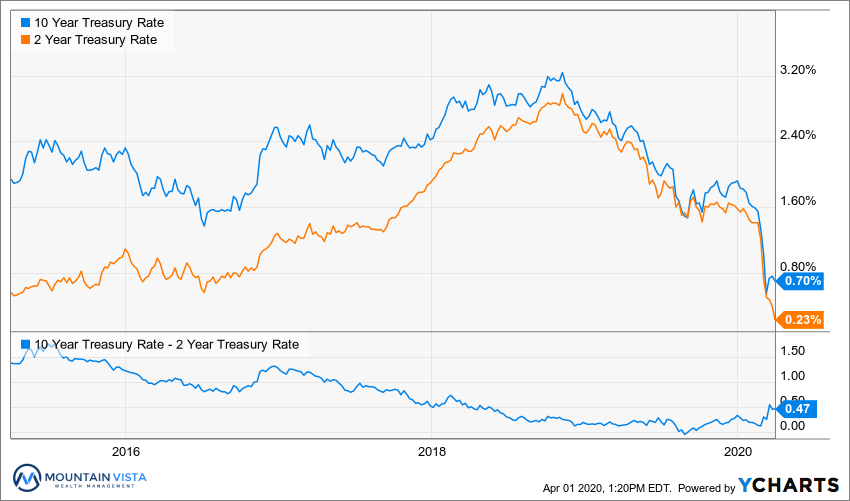
Treasury yields dropped precipitously as the Federal Reserve cut rates close to zero and risk aversion sky rocketed. The 10-year U.S. Treasury yield ended Q1 2020 at 0.7%, 122 bps lower than where it stood at the end of 2019. The spread between 2-year and 10-year treasury yields increased to 47 bps, but because of the Federal Reserve’s aggressive rate cuts, rather than increasing economic prospects.
While yields could certainly fall further, 10-year German bonds currently yield (-0.5%), we do not believe the Federal Reserve wants to reduce the funds rate below zero for fear of damaging the banking sector. With the amount of deficit spending taking place, and the potential for very strong growth after we exit the COVID-19 induced recession, the risk seems skewed towards higher long-term yields in the medium term.
Figure 6: U.S. Corporate Credit Spreads
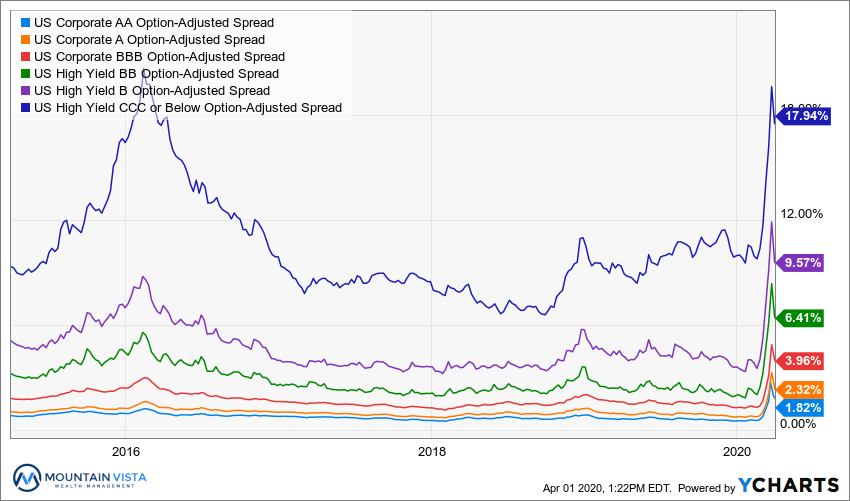
Corporate credit spreads widened markedly over the quarter. Default expectations have picked up commensurately, given the cashflow stress imposed by the mandatory closure of non-essential businesses.
CCC-rated bond spreads increased 786 bps over Q1 2020, reaching levels last seen in 2016 when large numbers of bonds in the Oil & Gas sector were defaulting. It is interesting that higher rated bonds have widened much more than they did in 2016. For example, BB-rated bond spreads are higher than B-rated spreads during the 2016 default cycle. This implies that the problem is more systemic, rather than tied to a handful of poorly performing bonds.
While the Federal Reserve has introduced a number of measures to improve the issuance and liquidity of investment grade bonds, high yield bonds are not yet receiving any direct support. Future spreads and defaults will be very sensitive to the length of time that the economy remains closed. Without a resumption of business, large scale downgrades and default seem likely.
CONCLUSION
Q1 2020 has been challenging on a number of fronts. Equities have suffered declines not experienced since the Financial Crisis; furthermore, all but the safest sectors of the Fixed Income market have also suffered losses. These are the times when an investor’s mettle is tested.
In last quarter’s commentary, quoted below, we discussed the importance of avoiding the herd mentality that creates the boom and bust cycle. We are now at the polar opposite of where we stood at the end of 2019, but the advice is still true.
“With both equites and fixed income producing strong annual gains over the last 12 months, it is easy to grow complacent, chase returns and increase risk. This is one of the behaviors that creates boom and bust cycles in the market. For those that participate in this behavior, the result is poor returns and endless frustration. We avoid this pitfall by staying true to our long-term asset allocation and rebalancing periodically.
Remember it was only a year ago that the S&P 500 fell by nearly 20% over the course of two months. Corrections, defined as a drop of at least 10%, occur every 1-2 years on average. It is during these periods, when it is most uncomfortable, that we should be increasing our risk exposure.”
We will be looking for opportunities to increase our equity allocations over the coming weeks and months, either because of lower prices or greater certainty of what the future holds. As Jack Bogle said, “…this too, shall pass.”
Disclaimer
The views and opinions expressed are for informational and educational purposes only as of the date of writing and may change at any time based on market or other conditions and may not come to pass. This material is not intended to be relied upon as investment advice or recommendations, does not constitute a solicitation to buy or sell securities and should not be considered specific legal, investment or tax advice. The information provided does not take into account the specific objectives, financial situation, or particular needs of any specific person. All investments carry a certain degree of risk and there is no assurance that an investment will provide positive performance over any period of time. Equity investments are subject to market risk or the risk that stocks will decline in response to such factors as adverse company news or industry developments or a general economic decline. Debt or fixed income securities are subject to market risk, credit risk, interest rate risk, call risk, tax risk, political and economic risk, and income risk. As interest rates rise, bond prices fall. Non-investment-grade bonds involve heightened credit risk, liquidity risk, and potential for default. Foreign investing involves additional risks, including currency fluctuation, political and economic instability, lack of liquidity and differing legal and accounting standards. These risks are magnified in emerging markets. Past performance is no guarantee of future results.