
INTRODUCTION
“Don’t look for the needle in the haystack. Just buy the haystack.” -Jack Bogle
In reviewing the performance of the broad market indices, one could be forgiven for assuming that it was a very orderly quarter. Not readily apparent in the returns is the (-8%) peak-to-trough drop of QQQ (Nasdaq 100 ETF) or the precipitous drop in high growth, “stay-at-home” stocks like Zoom, Teledoc or Peleton. Propping up the index performance, are companies in the energy, industrial and financial sectors.
Some may say that this return dispersion highlights the opportunity for active management to create alpha. I’ve also heard that this is a “stock-pickers market” repeatedly over the last 12 months. While there is a grain of truth to this, it is mostly marketing. There are market winners and losers every year.
The diversification and stability of the S&P 500 is a feature, not a bug. According to S&P Global’s most recent SPIVA Report, 60% of active U.S. large cap funds underperformed the S&P 500 in 2020. Over the last five years, that number grows to 75%. In truth, it is difficult to navigate the shifts in market dynamics and most active managers fail to do so over a multi-year period.
Rather than chase performance or the current shiny object, we maintain diversified portfolios, constructed with low-cost ETFs. We improve the risk and return characteristics of the portfolio, by layering in sector ETFs. For example, we were overweight technology for most of 2020 and have been overweight financials and industrials in recent months. We believe that this approach provides our clients with the best chance of avoiding major set-backs and capturing the attractive long-term returns that the equity market has historically delivered to patient investors.
We deeply appreciate your confidence and will continue to work tirelessly to improve your financial future. Stay safe and stay invested!
Sincerely,

Jonathan R. Heagle, CFP®, CFA
President and Chief Investment Officer
OVERALL MARKET COMMENTARY
In the first few months of 2021, there were a handful of shifts taking place in the market. Namely, a crash in high multiple growth stocks, a complete repricing of long-term fixed income complex and a breakdown in the SPAC/IPO frenzy that peaked in 2020.
At the core of the market action are two narratives. First, with vaccination levels rising rapidly in the U.S. and an unprecedented level of fiscal stimulus, the economy is likely to boom this year. The Federal Reserve Board’s most recent projection for 2021 real GDP growth was 6.5%. Consider that we have not seen growth above 5% since 1984! The second narrative is that inflation is coming. After being locked inside for over a year, there is likely to be a spending spree when life returns to normal. Also, COVID has disrupted supply chains, making a variety of resources, from lumber to semi-conductors, scarcer. Near-term inflation is universally accepted, but there is a debate on what will happen with inflation over the medium term.
These two narratives have pushed up prices of energy, financial and industrial sector stocks. Cyclical sectors stand to benefit from strong growth and a steepening yield curve. Technology and high growth stocks are not fairing as well, because the realization of their economic value is far in the future. Like a long duration bond, this makes them more susceptible to increases in their discount rate. Also, the beneficiaries of the “stay-at-home’ economy are going to face difficult comparisons to last year’s results, weighing on their growth in the near-term.
Goodbye “stay-at-home”, hello “reopening”
Last year was all about highly innovative, futuristic technology companies that were changing the world and how we live. Most of the companies that fall into this category are still in their growth phase, making investments into R&D or client acquisition with the hopes of growing their market share. To value these companies, investors rely on estimates of TAM, or total addressable market. The result is often lofty Price-to-Sales multiples that the companies will theoretically grow into overtime.
In 2021, expectations of strong economic growth and a return to normal have shifted attention to cyclical and “epicenter” stocks. Think travel, experiences and fossil fuels. After suffering from shutdowns in 2020, these companies will likely experience strong earnings growth on a year-over-year basis, making them the growth stocks of 2021.
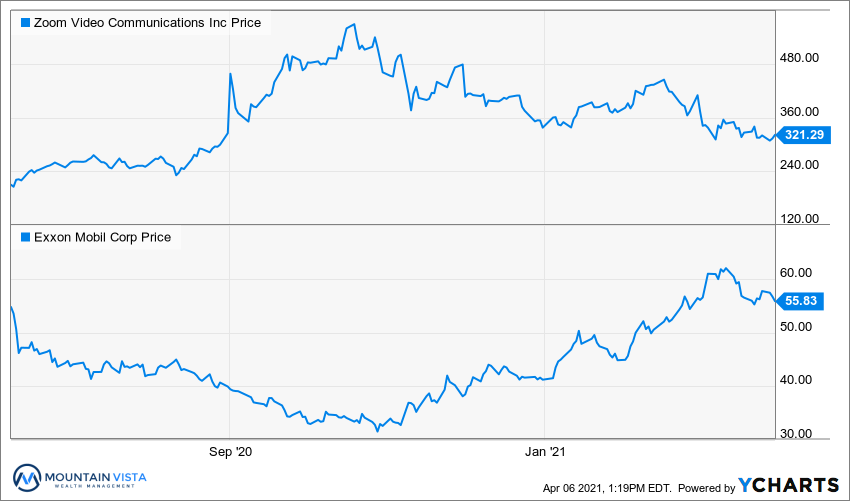
To illustrate the fortunes of these two groups of stocks, look no further than the charts of Zoom and Exxon.
Figure 1: Prices of ZM and XON stock since June 8, 2020
SPACs and IPOs take a hit
As a reminder, an “IPO” is an Initial Public Offering of a company. A “SPAC” is a Special Purpose Acquisition Company that has no commercial operations, but, rather, is formed to raise funds through an IPO to then acquire an existing company.
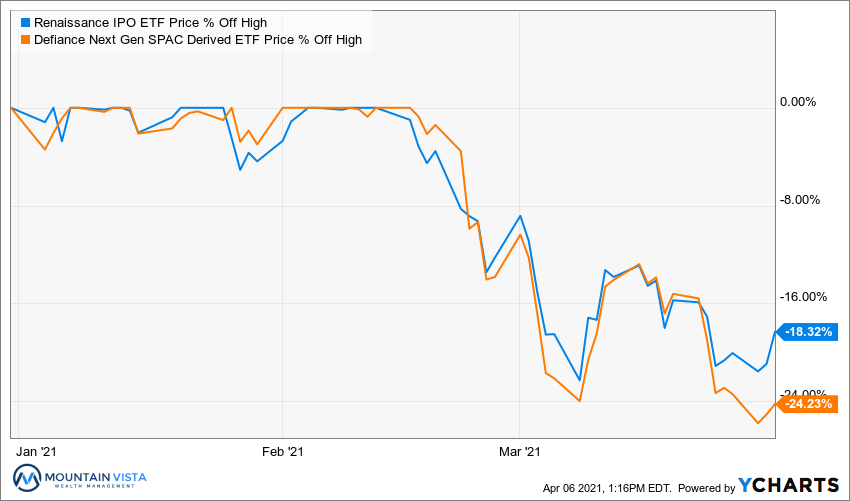
Last quarter we highlighted the deluge of companies going public, either through IPO or a reverse merger with a SPAC. As displayed in the chart below, prices of SPACs and recently completed IPOs have suffered over the last month. The party could not continue forever. Let’s see how bad the hang over is…
Figure 2: Total Return of IPO and SPAK Year-to-Date
EQUITY MARKET
Figure 3: Equity Index ETF Returns
| ETF | Description | Q1 2021 Total Return | 2020 Total Return |
| SPY | S&P 500 | 6.4% | 18.3% |
| QQQ | Nasdaq 100 | 1.8% | 48.6% |
| IWM | Russell 2000 | 12.9% | 20.0% |
| IVW | S&P 500 Growth | 2.2% | 33.2% |
| IVE | S&P 500 Value | 10.9% | 1.2% |
| VXUS | International Ex-US | 4.5% | 10.7% |
| IEMG | Emerging Markets | 3.7% | 17.9% |
While the 1st quarter of 2021 was positive for stocks, some corners of the market struggled. SPY (S&P 500 ETF) returned 6.4% in the quarter, which is strong by any standard, but QQQ (Nasdaq 100 ETF) returned only 1.8% with meaningful price volatility. This performance gap is a result of a rotation taking place, as investors ditched the stocks of companies that thrived during the lockdown economy, in favor of those that will benefit from a reopening and strong economic growth.
Small capitalization stocks were very strong in the early part of the 1st quarter, but cooled off in recent weeks. IWM (Russell 2000 ETF) managed a 12.9% return in Q1 2021, but was up nearly 20% year-to-date in mid-March. With expectations of real U.S. GDP growth in the high single digits for 2021, U.S. small cap stocks are seen as major beneficiaries. The large gains over the last two quarters more than offset their underperformance versus U.S. large capitalization stocks in the first three quarters of 2020.
For once, value stock investors have had reason to celebrate. IVE (S&P 500 Value ETF) outperformed IVW (S&P 500 Growth ETF) in the 1th quarter with a 10.9% return, resulting in an outperformance of 8.7%. With expectations of strong economic growth, increasing long-term interest rates and historically elevated valuations for growth stocks, the environment continues to support a value tilt for the time being. From January 2020 through September 2020, IVW had outperformed IVE by 38%. This spread has since shrunk to 26%.
International equities held their own versus U.S. stocks, while Emerging Markets underperformed. In the 1th quarter, VXUS (International ETF) and IEMG (Emerging Market ETF) returned 4.5% and 3.7%, respectively. Expectations for Emerging Market equities were high entering 2021 and at one point in February, IEMG was had returned 12%. Those gains have since been eroded as concerns about China’s adverse actions towards domestic technology companies have resulted in a meaningful correction in their stock prices. Also, many foreign countries continue to struggle with very high levels of COVID cases.
We maintain a neutral weight towards equities, given the strong economic backdrop and historically low bond yields. We expect continued volatility as interest rates continue to normalize.
Figure 4: Equity Sector Returns
| ETF | Description | Q1 2021 Total Return | 2020 Total Return |
| XLE | Energy | 30.8% | (32.7%) |
| XLF | Financials | 16.0% | (1.7%) |
| XLI | Industrials | 11.5% | 10.9% |
| XLB | Materials | 9.3% | 20.5% |
| XLRE | Real Estate | 9.1% | (2.2%) |
| XLC | Communications | 8.8% | 26.9% |
| IYZ | Telecom | 7.8% | 4.1% |
| XLY | Consumer Disc | 4.7% | 29.6% |
| XLV | Healthcare | 3.3% | 13.3% |
| XLU | Utilities | 2.9% | 0.5% |
| XLK | Technology | 2.4% | 43.6% |
| XLP | Consumer Staples | 1.8% | 10.1% |
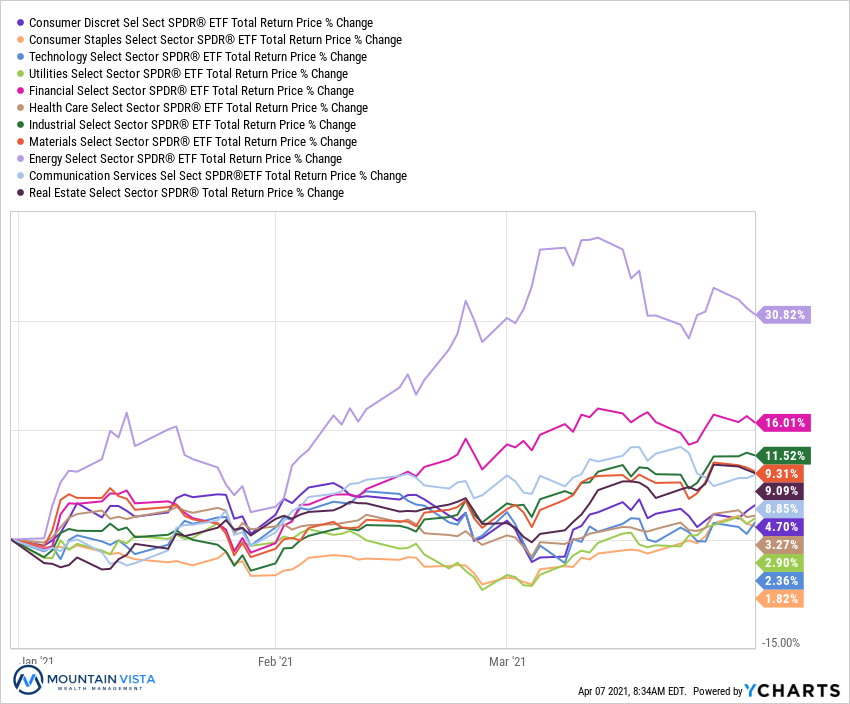
In the 1st quarter, there was an acceleration of the cyclical/value-oriented outperformance that established itself at the end of 2020. XLE (Energy Sector ETF), XLF (Financial Sector ETF) and XLI (Industrials Sector ETF) led the market with quarterly returns of 30.8%, 16.0% and 11.5%, respectively. This “rotation” trade, was a result of investors buying sectors that are likely to benefit from a re-opening of the economy and a likely infrastructure bill. Financials also benefit from the increasingly steep yield curve, as the Federal Reserve keeps short-term rates near zero, while long-term rates increase along with growth and inflation expectations.
XLK (Technology Sector ETF) returned a paltry 2.4%, after leading all sectors in 2020. Tech was a major beneficiary of the stay-at-home economy and very low long-term interest rates. In 2021, tech may continue to face headwinds, as rates push higher and growth can be found a much cheaper valuations in other sectors. XLU (Utilities Sector ETF) and XLP (Consumer Staples Sector ETF) were also laggards, with Q1 2021 returns of 2.9% and 1.8%, respectively.
We remain overweight industrials and financials, as we believe the risk/reward is more favorable during the coming period of high real GDP growth and increasing interest rates. That being said, we would not be surprised to interest rates consolidate for a period of time, given the speed of the move higher. If this occurs, we could see temporary strength in technology. Since our view is that long term rates will continue to move higher over the 2nd quarter, as growth and inflation pick up, we are not positioning for this move.
Figure 5: Equity Sector Year-to-Date Total Return
FIXED INCOME MARKET
Figure 6: Fixed Income Returns
| ETF | Description | Q1 2021 Total Return | 2020 Total Return |
| AGG | Aggregate Bond | (3.4%) | 7.5% |
| BND | Total Bond Market | (3.6%) | 7.7% |
| LQD | IG Corporate | (5.5%) | 11.0% |
| JNK | HY Corporate | 0.6% | 4.9% |
| EMB | $ EM Bonds | (5.5%) | 5.4% |
| SHY | 1-3 Yr Treasuries | (0.1%) | 3.0% |
| IEF | 7-10 Yr Treasuries | (5.7%) | 10.0% |
| TLT | 20+ Yr Treasuries | (13.9%) | 18.2% |
| TIP | TIPs | (1.7%) | 10.8% |
Long-term interest rates moved rapidly higher over the course of the 1st quarter as growth and inflation expectations picked up. The 10-year U.S. Treasury yield ended the quarter at 1.74%, an increase of 81 bps. Despite the dramatic rise, we believe that yields could increase further in the coming months.
Amongst U.S. fixed income sectors, JNK (HY Corporate Bond ETF) was the top performer and the only fixed income ETF that we track to produce a positive return in the quarter. TLT (U.S. Treasury 20+ year ETF) saw the largest decline with a 1st quarter return of (-13.9%). With the longest duration, or sensitivity to interest rates, it is no surprise that TLT underperformed.
EMB (Emerging Market Dollar Bond ETF) returned (-5.5%) in the quarter. Emerging market bonds are less attractive as the dollar strengthened and yields in developed countries increased.
While the adjustment to higher rates is not beneficial to our portfolios in the short term, the increased yields make fixed income a more attractive component of a diversified portfolio going forward. In addition to the producing more income, fixed income should, once again, provide a buffer against deflation and equity market volatility.
We remain underweight fixed income, in favor of cash, but we will likely move back to a neutral weight if the 10 year U.S. Treasury yield approaches 2% in the coming months.
Figure 7: U.S. Treasury Yields
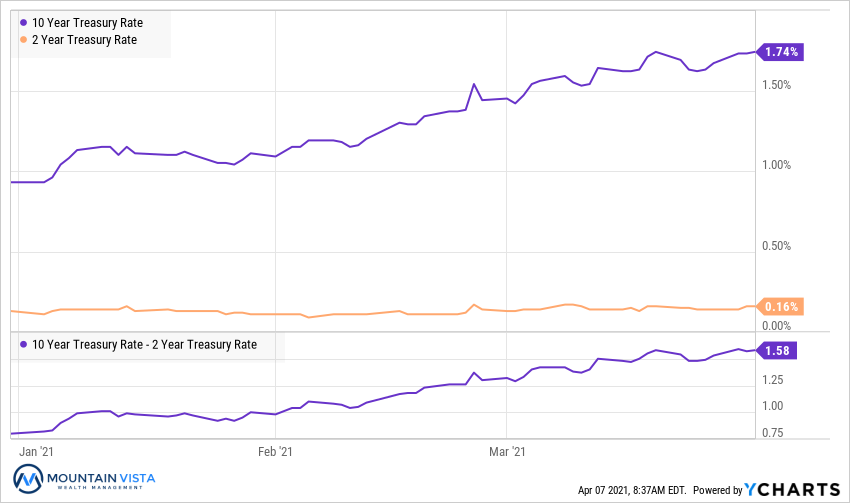
The treasury curve continued to steepen in the 1st quarter. 10-year U.S. Treasury yields increased 81 bps, while the 2-year U.S. Treasury yield increased 3 bp. This resulted in a 78 bp increase in the spread between 2’s and 10’s. The steepening of the curve fueled the financial sector outperformance in the quarter.
We highlighted how unattractive long-term bonds were last quarter and the decision to be underweight fixed income and to reduce the duration of holdings was well timed. We still believe that bond yields are likely to move higher in the coming months as strong growth and inflation data is registered. That being said, a period of consolidation would not be surprising, given the speed and magnitude of the move higher.
Figure 8: U.S. Corporate Credit Spreads
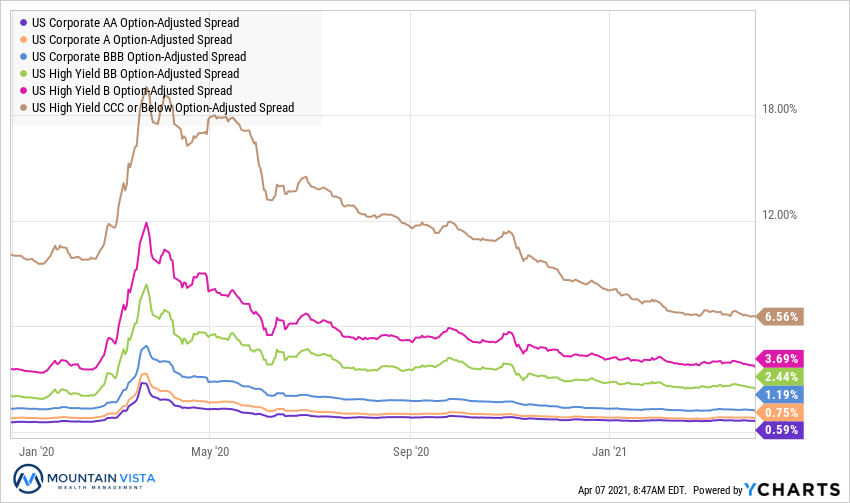
Corporate credit spreads continued to tighten over the course of the 1st quarter, largely ignoring the volatility in some corners of the equity market and U.S. Treasury market. Clearly the combination of Federal Reserve support and very strong economic growth have dominated the direction of spreads.
CCC-rated bond spreads tightened by 147 bps over the 1st quarter and are back to levels last seen in 2014. The drop in CCC-rated spreads makes sense when you consider that inflation and growth are expected to be so strong in 2021, but the absolute level remains impressive. AA-rated bonds tightened by 4 bps and back to pre-pandemic levels.
The credit markets continue to flash green, which implies that drops in the equity markets are likely to be buying opportunities.
CONCLUSION
If the last 12 months have taught us anything, it is that markets are constantly changing. Today’s momentum stock can quickly turn into a value trap. We work tirelessly to stay one step ahead, avoiding pitfalls and seizing on opportunity. These efforts aim to improve the risk-return characteristics of the portfolio, helping our clients survive the ebbs and flow of the market and earn the attractive long-term returns that patient investors have historically enjoyed.
Thank you to our clients for your continued support of Mountain Vista. I wish everyone a healthy and prosperous 2021!
Sincerely,
Jonathan R. Heagle, CFP®, CFA
President and CIO
Disclaimer
The views and opinions expressed are for informational and educational purposes only as of the date of writing and may change at any time based on market or other conditions and may not come to pass. This material is not intended to be relied upon as investment advice or recommendations, does not constitute a solicitation to buy or sell securities and should not be considered specific legal, investment or tax advice. The information provided does not take into account the specific objectives, financial situation, or particular needs of any specific person. All investments carry a certain degree of risk and there is no assurance that an investment will provide positive performance over any period of time. Equity investments are subject to market risk or the risk that stocks will decline in response to such factors as adverse company news or industry developments or a general economic decline. Debt or fixed income securities are subject to market risk, credit risk, interest rate risk, call risk, tax risk, political and economic risk, and income risk. As interest rates rise, bond prices fall. Non-investment-grade bonds involve heightened credit risk, liquidity risk, and potential for default. Foreign investing involves additional risks, including currency fluctuation, political and economic instability, lack of liquidity and differing legal and accounting standards. These risks are magnified in emerging markets. Past performance is no guarantee of future results.