
INTRODUCTION
“Although the world is full of suffering, it is also full of overcoming it. ” -Helen Keller
Working in the financial markets is somewhat unique to other professions. Our daily tasks are often impacted by trends and events that occur in unrelated sectors or locations thousands of miles away. For this reason, we are sometimes forced to be knowledgeable in areas that extend far beyond the value of a security. It is important to remain humble in these situations and to be skeptical of anyone that claims to have a crystal ball.
Some situations are more challenging than others to handicap. The outcome of the war in Ukraine is largely dependent upon the decisions made by one individual, deemed by many to be irrational. This heightened uncertainty, coupled with a Federal Reserve that is starting to tighten monetary conditions, caused the equity market to drop precipitously through mid-March. Since then, prices have rebounded quickly, but the market will likely remain volatile.
Despite the litany of obstacles facing investors, it is important to remain allocated to equities. Sentiment can change quickly, as we learned in March when the Nasdaq 100 rallied 10% over three trading days. Furthermore, the economy is still growing, jobs are plentiful and real rates (nominal yields minus inflation) are still negative. Suffering through periods of flat or negative returns is the price of admission to capture the 8-10% long-term returns of the stock market.
This is all of little consolation to the Ukrainian people who are suffering tremendously, losing loved ones and are unable to return home. I write about the market impacts of the war, because that is my job. As a human, I am deeply impacted by what I am seeing and reading. I am also inspired by the bravery and unity of the Ukrainian people. If there is a silver lining to this war, it is that democracies around the world seem to have woken up to the threat posed by authoritarian regimes.
During these uncertain times, we will continue in our efforts to safeguard and grow your hard-earned savings. Thank you.
Sincerely,

Jonathan R. Heagle, CFP®, CFA
President and Chief Investment Officer
OVERALL MARKET COMMENTARY
The year 2022 is only three months old, but markets have experienced an outsized share of activity. In mid-March, the Nasdaq 100 entered a bear market (drop of 20%) and the S&P 500 reached correction levels (drop of 10%). Making matters worse, fixed income failed to provide its usual cushion to the stock market’s fall. Over the course of the 1st quarter, the 10-year treasury yield increased by 80 bps and the 2-year treasury yield increased by an astounding 155 bps. AGG, which tracks the Bloomberg U.S. Aggregate Bond Index, is down (-5.8%) year-to-date.
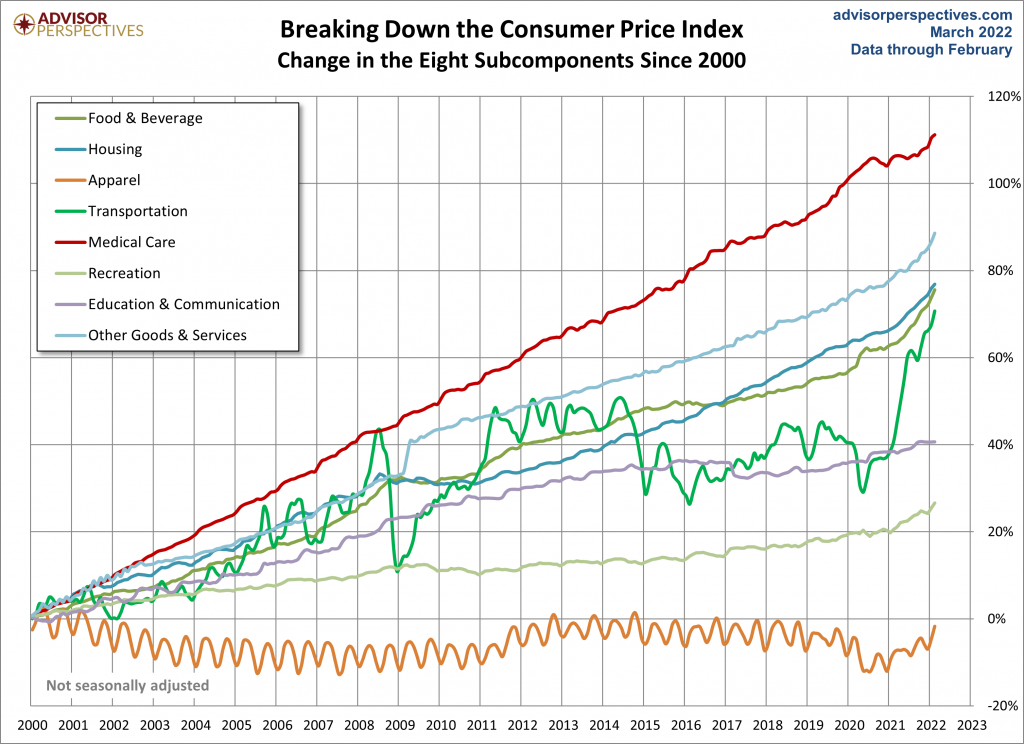
One source of this volatility is accelerating and expanding inflation. Through the end of February 2022, the headline CPI increased 7.9% year-over-year. While energy and pandemic affected items, such as used cars, continue to drive the headline, inflationary pressures continue to broaden out to across most categories. Stripping out food and energy, year-over-year inflation was still an unacceptable 6.4%. As you can see in Figure 1, price increases have accelerated in all categories, except for Education and Communication.
Figure 1: Consumer Price Index by Subcomponent
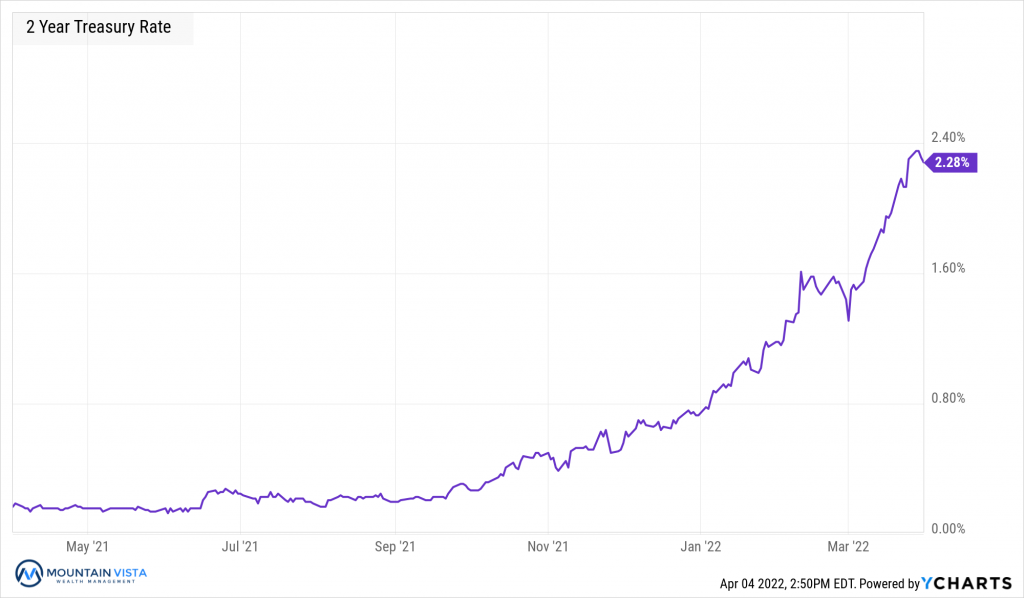
High levels of inflation are translating through to market volatility, because the Federal Reserve will be forced to aggressively increase interest rates in order to reduce demand, increasing the risk of a recession. To understand the magnitude of the issue, consider that the Federal Reserve has only raised interest rates by 25 bps to a target range of 0.25% to 0.50%. We can expect many more rate increases over the next two years, based upon the increase in the 2-year treasury yield, which closed the 1st quarter at 2.28%.
Figure 2: 2-year U.S. Treasury Bond Yield
The equity market can no longer rely on the Federal Reserve to provide support should equity prices fall, because reestablishing price stability will be their top priority. The removal of this “Fed put” should lead to greater volatility and the potential of a more serious downturn in stock prices.
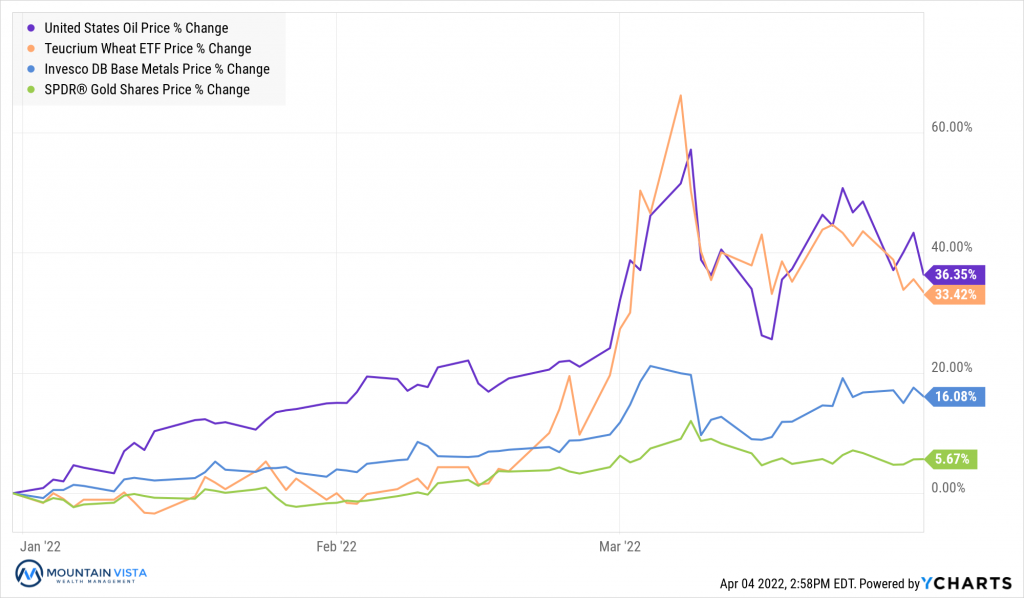
The Russian invasion of Ukraine only made the Federal Reserve’s inflation problem worse. Russia and Ukraine are important suppliers of a number of commodities, such as wheat and oil. Production of Ukrainian commodities will likely suffer directly from the conflict, but sanctions will impact the supply of Russian commodities to NATO countries. Reduced supply leads to higher prices, which causes more inflation. In Figure 3, you can see oil and wheat prices spike at the time of the invasion on February 24th.
Figure 3: Select Commodities Year-to-Date Returns
EQUITY MARKET
Figure 4: Equity Index ETF Returns
| ETF | Description | Q1 2022 Total Return | Total Return thru March 14th |
| SPY | S&P 500 | (4.6%) | (12.2%) |
| QQQ | Nasdaq 100 | (8.8%) | (20.0%) |
| IWM | Russell 2000 | (7.5%) | (13.4%) |
| IVW | S&P 500 Growth | (8.6%) | (18.3%) |
| IVE | S&P 500 Value | (0.1%) | (5.3%) |
| VXUS | International Ex-US | (5.9%) | (11.6%) |
| IEMG | Emerging Markets | (7.2%) | (14.4%) |
The 1st quarter of 2022 was challenging for major U.S. equity indices. SPY (S&P 500 ETF) and QQQ (Nasdaq 100 ETF) returned (-4.6%) and (-8.8%), respectively. While disappointing, the returns look much better than the low close on March 14th, which saw trough declines of (-12%) and (-20%) for the two indices, year-to-date.
Small capitalization stocks continued to struggle, relative to large capitalization stocks. IWM (Russell 2000 ETF) returned (-7.5%) in the 1st quarter. Unlike the other indices, IWM peaked in early November and has suffered a larger peak-to-trough decline, which ended the quarter at (-15.4%), than even the QQQ.
Value stocks outperformed Growth stocks by 8.4% in the 1th quarter. Inflation and increasing interest rates dominated investor attention, putting pressure on stocks with high valuation multiples and low or no current earnings. IVE (S&P 500 Value ETF) and IVW (S&P 500 Growth ETF) generated quarterly returns of (-0.1%) and (-8.6%), respectively.
As we entered 2022, International equities and Emerging Market equities appeared poised to outperform U.S. equities. Then Russia invaded Ukraine. Emerging markets face higher geopolitical risks and Europe is very dependent upon Russia for its energy supply. In the 1st quarter, VXUS (International ETF) declined (-5.9%) and IEMG (Emerging Market ETF) fell (-7.2%).
We expect volatility to persist as the Federal Reserve removes accommodative monetary policy. In doing so, they are trying to bring inflation back down to their 2% target without triggering a recession. Based upon history, it is not likely that they will succeed.
Figure 5: Equity Sector Returns
| ETF | Description | Q1 2022 Total Return | Total Return thru March 14th |
| XLE | Energy | 39.0% | 34.3% |
| XLU | Utilities | 4.7% | (1.7%) |
| XLP | Consumer Staples | (1.1%) | (6.9%) |
| XLF | Financials | (1.5%) | (5.6%) |
| XLB | Materials | (2.3%) | (9.8%) |
| XLI | Industrials | (2.4%) | (7.1%) |
| XLV | Healthcare | (2.5%) | (7.8%) |
| XLRE | Real Estate | (6.2%) | (12.0%) |
| XLK | Technology | (8.4%) | (18.7%) |
| IYZ | Telecom | (8.7%) | (12.8%) |
| XLY | Consumer Disc | (9.4%) | (19.8%) |
| XLC | Communications | (11.2%) | (18.1%) |
XLE (Energy Sector ETF) was far-and-away the top performing sector in the 1st quarter with a return of 39.0%. XLU (Utilities Sector ETF) was the only other sector that is positive year-to-date, with a quarterly return of 4.7%.
XLC (Communications Sector ETF) and XLY (Consumer Discretionary Sector ETF) were the laggards with 1st quarter returns of (-11.2%) and (-9.4%), respectively. XLC was negatively impacted by the performance of FB (Meta Platforms/Facebook) and XLY was impacted by concerns about consumers spending in light of high gas prices.
Over the 1st quarter, we maintained a defensive posture with an overweight in consumer staples. We removed our positions in XLF (Financial Sector ETF) and XLRE (Real Estate Sector ETF) intra-quarter and added XLE (Energy Sector ETF).

FIXED INCOME MARKET
Figure 7: Fixed Income Returns
| ETF | Description | Q1 2022 Total Return | Total Return thru March 14th |
| AGG | Aggregate Bond | (5.8%) | (5.6%) |
| BND | Total Bond Market | (5.8%) | (5.7%) |
| LQD | IG Corporate | (8.4%) | (10.3%) |
| JNK | HY Corporate | (4.9%) | (7.6%) |
| EMB | $ EM Bonds | (9.7%) | (12.4%) |
| SHY | 1-3 Yr Treasuries | (2.5%) | (1.8%) |
| IEF | 7-10 Yr Treasuries | (6.4%) | (4.9%) |
| TLT | 20+ Yr Treasuries | (10.6%) | (10.8%) |
| TIP | TIPs | (3.1%) | (1.1%) |
It was a brutal start of the year for the entire fixed income universe. As it became clear the Federal Reserve was “behind the curve” in controlling inflation, expectations of future rate increases accumulated quickly. The 2-year U.S. Treasury Bond yield increased an incredible 155 bps from 0.73% to 2.28%. The 10-year U.S. Treasury Bond yield increased 80 bps to 2.32%.
TIP (U.S. Treasury Inflation Protected ETF) and SHY (1-3 Year US Treasury ETF) faired the best, losing (-3.1%) and (-2.5%), respectively, in the 1st quarter. With inflation surprising to the upside and the abrupt move higher in rates across all maturities, it is not a surprise that TIP and SHY were the top performers.
EMB (Emerging Market Dollar Bond ETF) and TLT (20+ Year US Treasury ETF) fell (-9.7%) and
(-10.6%), respectively. EMB was pressured by dollar strength and risk aversion caused by Russian sanctions and the war in Ukraine, generally. TLT has the most rate sensitivity of the fixed income ETFs and was meaningfully impacted by increases in long-term rates.
We are slightly overweight fixed income after the increase in rates. We were admittedly early, but believe that the pressure of higher interest rates will ease over the coming months, as the economy slows and inflationary pressures ease.
Figure 8: U.S. Treasury Yields
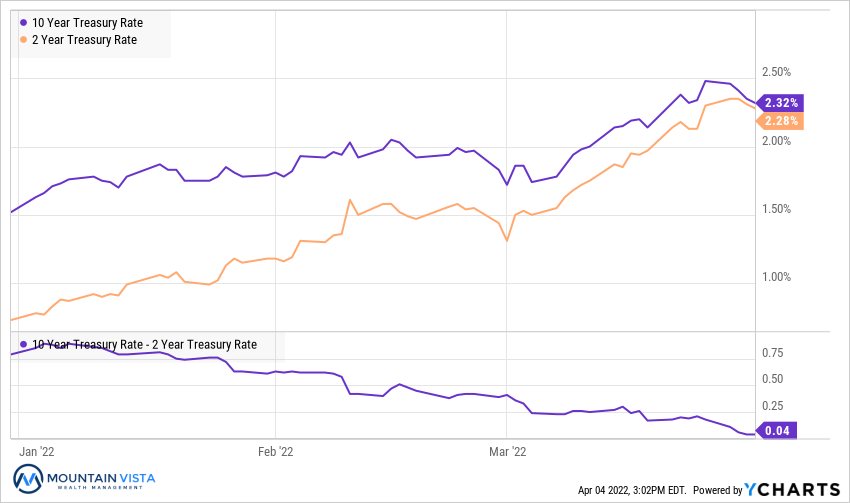
The U.S. Treasury curve flattened materially in the 1st quarter, as the yield on 2-year U.S. Treasury bonds increased 155 bps, while the yield on 10-year U.S. Treasury bonds only increased by 80 bps. This resulted in a 75 bps drop in the spread between 2’s and 10’s. At 4 bps, many are watching this measure closely, as a negative value has been a very reliable predictor of a coming recession.
As the Federal Reserve starts quantitative tightening, we will be watching long-term yields and the 2-10 spread. Historically, a reduction in bond buying has actually caused downward pressure on the 2-10 spread and long-term rates, but that was during a much different inflationary environment.
Figure 9: U.S. Corporate Credit Spreads
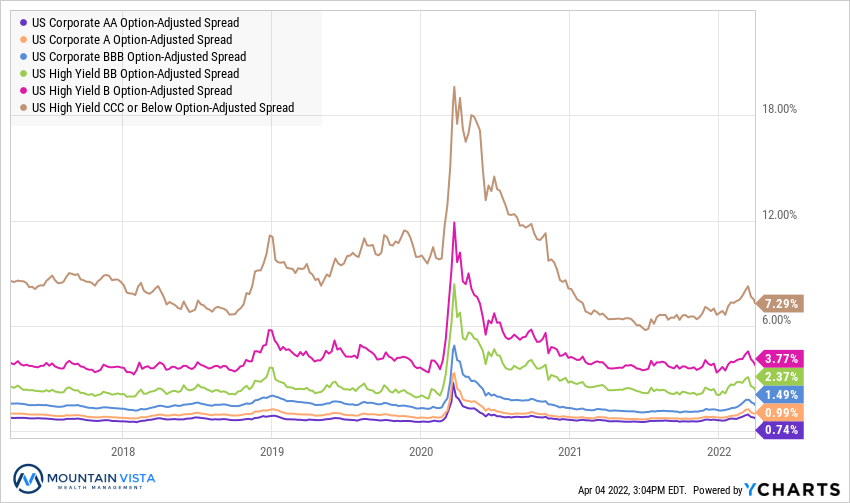
Corporate credit spreads drifted higher over the 1st quarter but are well off the mid-March highs. While spreads did increase during the volatility in March, their absolute levels were nowhere near what we saw in the 4th quarter of 2019 or most of 2020. Should the Fed succeed in bringing down inflation and growth, it would not be surprising to see spreads increase down the credit curve.
CCC-rated and AA-rated bond spreads widened by 51 bps and 12 bps, respectively over the 1st quarter, resulting in a steeper credit curve.
Credit markets continue to be very well behaved. Should we see spreads on lower rated bonds widening, we will be more concerned about a material and lasting correction in equities.
CONCLUSION
As we discussed in the conclusion of our last letter, the S&P 500 was coming off of three consecutive double-digit annual gains. This meant that we were on high alert for a weak period of equity performance. Well, we got it! Through the close on March 14th, the S&P 500 was down (-12%) and the Nasdaq 100 was lower by (-20%) year-to-date.
Living through down markets is never enjoyable, but it is important to put some historical context to the recent moves. Since 1950, the average peak-to-trough decline in the S&P 500 has been (-13.6%). A correction of (-10%) or more occurs about every two years and a bear market of 20% of more, approximately every 7 years.
While the current period feels uncertain, it always does during a correction. The economy is still growing, and interest rates are still historically low, so there is no reason to believe that the correction will immediately devolve into something much worse. We believe the Federal Reserve does not want to push the economy into a recession and will back off on tightening should economic indicators slow too dramatically.
Thank you to our clients for your continued support of Mountain Vista. We are dedicated to helping you navigate this uncertain time and are constantly looking for ways to improve the risk-reward profile of your investment portfolio.
Sincerely,
Jonathan R. Heagle, CFP®, CFA
President and Chief Investment Officer
Disclaimer
The views and opinions expressed are for informational and educational purposes only as of the date of writing and may change at any time based on market or other conditions and may not come to pass. This material is not intended to be relied upon as investment advice or recommendations, does not constitute a solicitation to buy or sell securities and should not be considered specific legal, investment or tax advice. The information provided does not take into account the specific objectives, financial situation, or particular needs of any specific person. All investments carry a certain degree of risk and there is no assurance that an investment will provide positive performance over any period of time. Equity investments are subject to market risk or the risk that stocks will decline in response to such factors as adverse company news or industry developments or a general economic decline. Debt or fixed income securities are subject to market risk, credit risk, interest rate risk, call risk, tax risk, political and economic risk, and income risk. As interest rates rise, bond prices fall. Non-investment-grade bonds involve heightened credit risk, liquidity risk, and potential for default. Foreign investing involves additional risks, including currency fluctuation, political and economic instability, lack of liquidity and differing legal and accounting standards. These risks are magnified in emerging markets. Past performance is no guarantee of future results.