 INTRODUCTION
“A banker is a fellow who lends you his umbrella when the sun is shining, but wants it back the minute it begins to rain” -Mark Twain
Before we dig through the financial market activity of the 1st quarter, I wanted to address the turmoil in the financial sector and some common concerns and misconceptions about the safety of your cash and investment accounts.
First, while certain mid-sized regional banks have faced substantial pressure from unstable deposit bases and unrealized losses on a portion of their fixed rate loans and investments, the overall banking sector is not exposed like it was in 2008/2009. Banking regulations put into place for large, systemically important banks have resulted in a much more stable and well-capitalized banking system. That being said, in 2018, congress rolled back Dodd-Frank regulations for banks with under $250 billion of assets, which is why small and mid-sized banks are feeling the most pressure.
Second, clients’ fully paid securities held in investment accounts are segregated from the brokerage firm’s assets, are not available to the brokerage firm’s creditors in the event of bankruptcy, and are completely owned by the client. While the bankruptcy of your brokerage institution would not be comforting, your investments should be secure.
Finally, cash held in an FDIC sweep account within an investment account is protected by FDIC insurance and securities holdings are insured up to $500,000 for theft, fraud or unauthorized trading by SIPC insurance.
If you or your business currently have bank accounts holding over $250,000 in cash, please reach out to your advisor to discuss strategies to protect those assets and maximize income.
Thank you to all of our clients for their continued support!
Sincerely,
Jonathan R. Heagle, CFP®, CFA
President and Chief Investment Officer
OVERALL MARKET COMMENTARY
The stock market celebrated the new year with a strong rally. In the 1st quarter, the Nasdaq 100 and S&P 500 returned 20.8% and 7.5%, respectively. Most of those gains took place in January, before a strong employment report (+517K) reignited fears of an overheating economy and high inflation.
Throughout February it seemed like the Federal Reserve was going to have to hike the Fed Funds rate towards 6% to slow the resilient economy. The yield on the 2-year increased by 80 bps over the month, pressuring stocks and ultimately leading to the failure of Silicon Valley Bank (“SVB”), Credit Suisse, and two other midsized banks.
Concerns over the stress in the financial sector and tighter lending standards, caused a complete unwind of February’s move in interest rates. Equity investors crowded into large capitalization technology stocks for their perceived safety and lack of exposure to the banking sector. Ironically, these flows pushed up the S&P 500 and Nasdaq 100, in particular. Not what you would expect during a bank panic!
What happened at Silicon Valley Bank?
As many financial analysts have suggested, the situation at SVB was unique. The bank’s deposit base was largely comprised of uninsured (over the FDIC’s $250K limit) accounts that were owned by start-up companies and venture capital funds. The bank experienced tremendous growth throughout 2020-2021, as money poured into technology startups. Instead of making loans with these funds, they largely invested the deposit windfall into mortgage-backed securities at generational low yields.
Figure 1: SVB Balance Sheet and Held-to-Maturity Security Portfolio Growth from 2020 to 2022
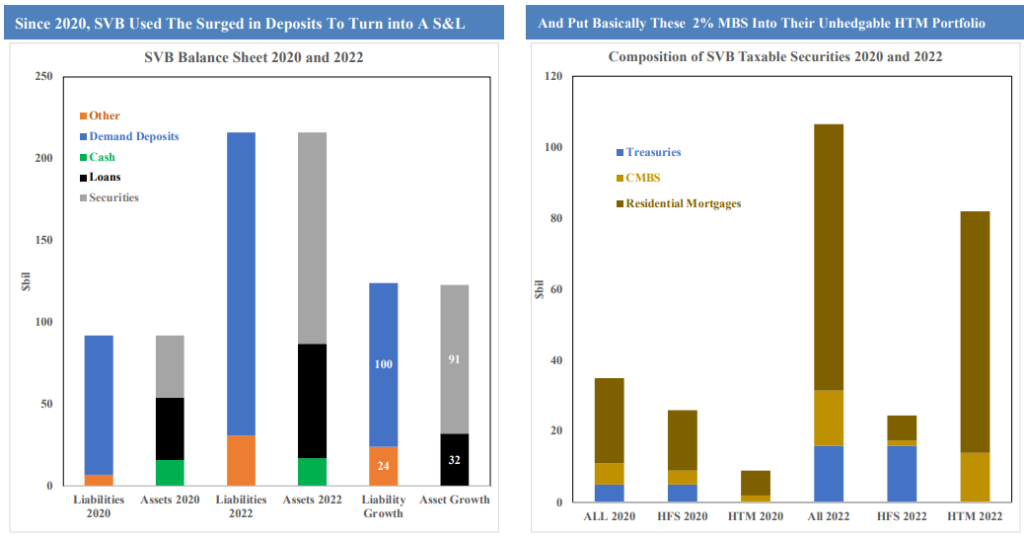
The unstable and concentrated deposit base, coupled with extremely rate sensitive investments, were the tinder and aggressive rate hikes by the Federal Reserve provided the spark that led to the firm’s insolvency.
While SVB was clearly the weakest of the regional banks and was uniquely concentrated in its client base, the problem of underwater investments and a shrinking deposit base is a broadscale problem for regional banks.
Figure 2: Unrealized Loss on Securities Portfolios and Quarterly Change in Deposits
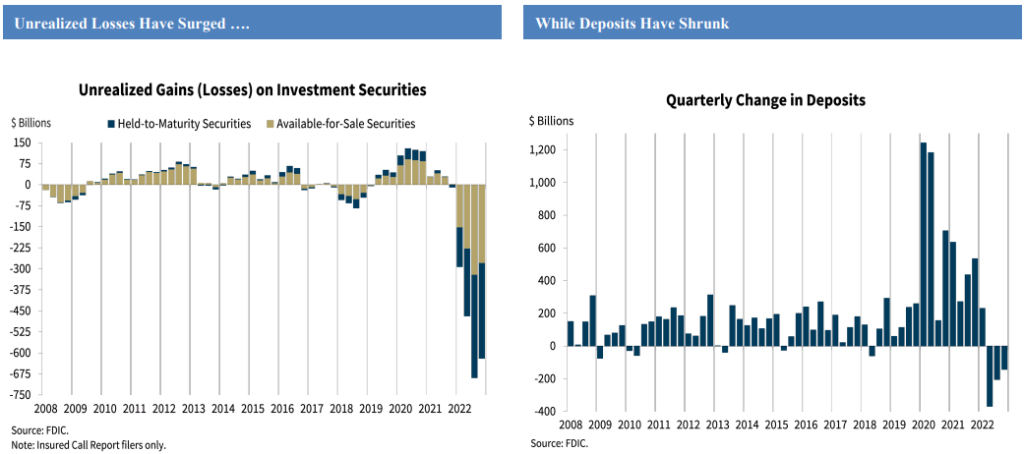
As you can see in Figure 2, unrealized losses on held-to-maturity and available-for-sale securities exceeds $600 billion across the industry. These losses are not realized unless the securities are sold, but when depositors ask for their money back, as they have been since 2022, these portfolios may need to be sold to meet the redemption requests.
While this is not exactly 2008, which was a solvency crisis at globally systemic financial institutions, this does look and feel a lot like the savings and loan crisis from the 1980s. With little incentive to keep deposits at susceptible institutions, depositors are likely to continue moving their uninsured deposits to the largest banks or purchase short-term government guaranteed investments. This story likely ends with further consolidation within the banking industry and, potentially, an explicit FDIC guarantee for some or all of the regional banks (currently) uninsured deposits.
The silver lining, if there is one, is that credit growth is likely to slow materially as regional banks tighten their lending standards and slow loan growth. This tightens financial conditions and will undoubtedly slow the economy and (ultimately) inflation. People often say that the Federal Reserve will hike rates until they break something. At the moment, regional banks are broken.
The 60/40 Portfolio is Working Again
The death of the 60/40 portfolio, which is a portfolio comprised of 60% S&P 500 and 40% U.S. Bonds, is a popular topic amongst active managers and the financial media. Most of the time I dismiss these takes as an attempt to attract eyeballs or management fees, but during the pandemic the argument made more sense.
Interest rates approached 0% for long-dated treasuries and equity valuations had detached from historical norms. Bonds lost their ability to hedge a downturn in equities and an increase in yields posed a threat to equity valuations!
At the end of 2021, Vanguard projected 10-year returns of 2.3% to 4.3% for U.S. equities and 1.4% to 2.4% for U.S. bonds. These returns were a far cry from the high single-digit returns that investors are expecting. This outlook caused us to consider alternative investments to improve diversification and enhance returns.
In 2022, the proverbial chickens came home to roost and the 60/40 portfolio suffered one of its worst years on record. Usually, bad returns were driven by large drawdowns in equities. What made 2022 uniquely difficult was that both equities and bonds were in a bear market. In Figure 3, you can see that stocks and bonds moved lower in lock-step.
Figure 3: Total Returns of 60/40 Portfolio, S&P 500 and Bloomberg U.S. Aggregate
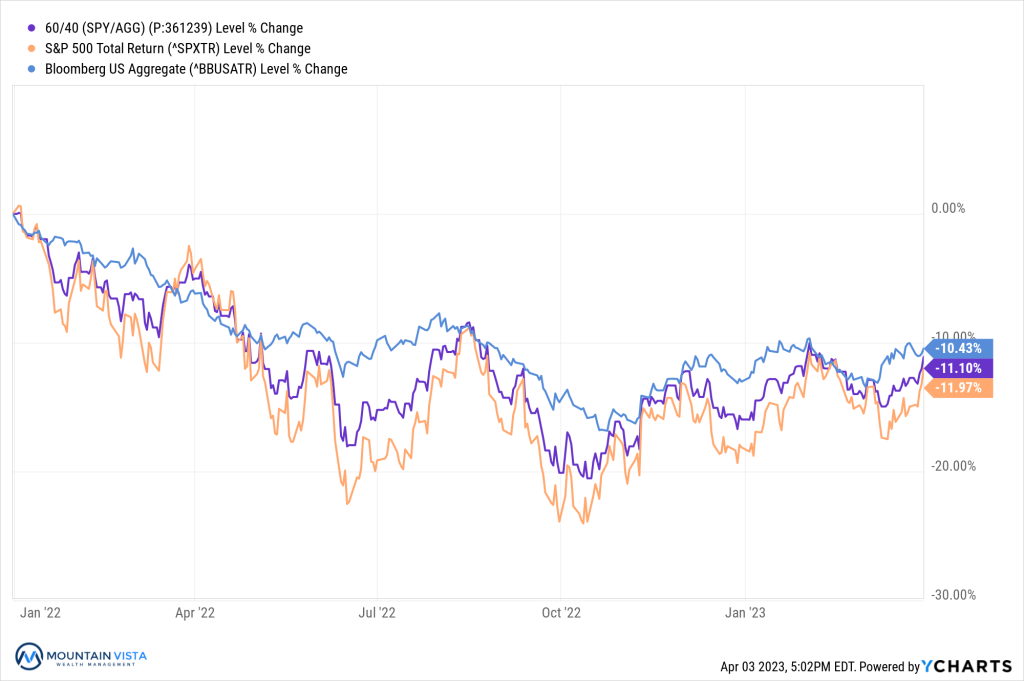
According to Yardini Research, the S&P 500’s forward price-to-earnings ratio was ~17x at the start of 2023, down from 22x in 2021, and the 2-year U.S. Treasury yield was 4.5%, up from ~0.2% in mid-2021. While these are not extremely cheap valuations from a historical perspective, they are consistent with historical averages. Clearly, the valuation of the 60/40 portfolio is much more reasonable than 18 months ago.
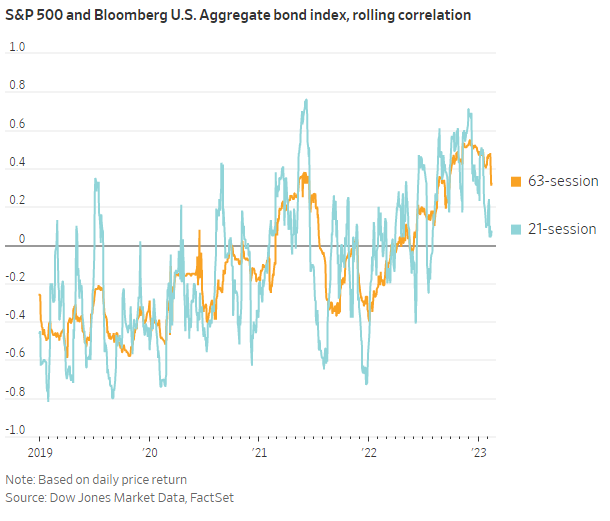
Historically, one of the primary benefits of the 60/40 portfolio was the stability provided by fixed income. During equity market volatility, investors would often drive up the price of bonds in a “flight to safety” trade. It was also reasonable for investors to expect lower future interest rates in response to slowing economic growth. For these reasons, bonds were expected to perform well during weak equity markets. Said another way, stocks and bonds were negatively correlated.
This relationship does not always hold. In 2022, stocks and bonds were positively correlated, as inflation hurt both asset classes. In Figure 4, you can see that correlations peaked in the 4th quarter of 2022, around the time when the market stock market bottomed.
With higher yields on fixed income and more reasonable equity valuations, the 60/40 portfolio looks is much more reasonably priced. Furthermore, as inflation becomes less of a concern to the market, it is possible that correlations will continue to fall.
Figure 4: Correlation of the S&P 500 and Bloomberg U.S. Aggregate (Wall Street Journal)
EQUITY MARKET
Figure 5: Equity Index ETF Returns
| ETF | Description | Q1 2023 Total Return | 2022 Total Return |
| SPY | S&P 500 | 7.5% | (18.2%) |
| QQQ | Nasdaq 100 | 20.7% | (32.6%) |
| IWM | Russell 2000 | 2.7% | (20.5%) |
| IVW | S&P 500 Growth | 9.5% | (29.5%) |
| IVE | S&P 500 Value | 5.1% | (5.4%) |
| VXUS | International Ex-US | 7.0% | (16.1%) |
| IEMG | Emerging Markets | 4.5% | (20.0%) |
Equity markets experienced strong gains in the 1st quarter of 2023. SPY (S&P 500 ETF) and QQQ (Nasdaq 100 ETF) returned 7.5% and 20.7% in the quarter, respectively. After lagging in the 4th quarter of 2022, QQQ made up for a lot of the underperformance.
Small capitalization stocks were higher in the quarter but underperformed the S&P 500 by (-4.8%). IWM (Russell 2000 ETF) returned 2.7% in the 1st quarter.
Growth stocks meaningfully outperformed Value stocks, after underperforming in 2022. IVW (S&P 500 Growth ETF) and IVE (S&P 500 Value ETF) generated quarterly returns of 9.5% and 5.1%, respectively, resulting in a 4.4% outperformance by Growth year-to-date.
After a strong January, International and Emerging Markets both underperformed the S&P 500 over the remainder of the 1st quarter. Year-to-date, VXUS (International ETF) has returned 7.0% and IEMG (Emerging Market ETF) has returned 4.5%. The underperformance is mostly explained by the strong performance of U.S. Large-Cap Technology stocks.
The market is still in wait-and-see mode, as inflation concerns are giving way to recession concerns. While economic data is clearly weakening, the consumer-based economy is still holding up very well. Stress in the regional banking sector has taken the edge off of the Federal Reserve’s rhetoric, and market participants expect curtailed lending to help slow inflation.
We continue to be underweight equities, as we monitor the economy and overweight short-duration fixed income. We have removed our VTV (Vanguard Value ETF) position, given its exposure to the financial sector, and have opted to utilize sector over weights to express our defensive tilt.
Figure 6: Equity Sector Returns
| ETF | Description | Q1 2023 Total Return | 2022 Total Return |
| XLK | Technology | 21.6% | (27.7%) |
| XLC | Communications | 21.1% | (37.6%) |
| XLY | Consumer Disc | 16.1% | (36.3%) |
| XLB | Materials | 4.3% | (12.3%) |
| IYZ | Telecom | 4.0% | (30.3%) |
| XLI | Industrials | 3.4% | (5.6%) |
| XLRE | Real Estate | 1.9% | (26.3%) |
| XLP | Consumer Staples | 0.7% | (0.8%) |
| XLU | Utilities | (3.3%) | 1.4% |
| XLE | Energy | (4.3%) | 64.3% |
| XLV | Healthcare | (4.3%) | (2.1%) |
| XLF | Financials | (5.5%) | (10.6%) |
XLK (Technology Sector ETF) and XLC (Communications Sector ETF) were the top performing sectors in the 1st quarter, returning 21.6% and 21.1%, respectively. These were two of the hardest hit sectors in 2022 and they benefited from an anticipated pause from the Federal Reserve and potential rate cuts in 2023.
XLF (Financial Sector ETF) and XLV (Healthcare Sector ETF) were the worst performing sectors in the 1st quarter. XLF and XLV returned (-5.5%) and (-4.3%), respectively. XLF suffered from the stress in the regional banking sector, while XLV lagged, along with other defensive sectors, due to conservative investor positioning heading into 2023.
We are defensively positioned with an overweight in XLU (Utilities Sector ETF) and XLV (Healthcare Sector ETF). We believe that the flows into large-cap technology stocks will pass, and they will not be a safe haven in the event of a true recession.
Figure 7: Equity Sector Quarterly Total Return

FIXED INCOME MARKET
Figure 8: Fixed Income Returns
| ETF | Description | Q1 2023 Total Return | 2022 Total Return |
| AGG | Aggregate Bond | 3.2% | (13.0%) |
| BND | Total Bond Market | 3.2% | (13.1%) |
| LQD | IG Corporate | 4.7% | (17.9%) |
| JNK | HY Corporate | 4.2% | (12.2%) |
| EMB | $ EM Bonds | 2.8% | (18.6%) |
| SHY | 1-3 Yr Treasuries | 1.6% | (3.9%) |
| IEF | 7-10 Yr Treasuries | 3.9% | (15.2%) |
| TLT | 20+ Yr Treasuries | 7.4% | (31.2%) |
| TIP | TIPs | 3.6% | (12.3%) |
Fixed income performance remained strong in the 1st quarter, as the banking stress pulled forward expectations of a Federal Reserve pause and potential recession. Should the stress facing regional banks subside, we may see yields drift higher, but it is very possible that we have seen the high in the 10-year U.S. Treasury yield.
TLT (20+ Year US Treasury ETF) returned 7.4% in the quarter after losing (-31.2%) in 2022. TLT has the most rate sensitivity of the fixed income ETFs and benefited from declines in long-term yields.
SHY (1-3 Year US Treasury ETF) lagged other fixed income exposures, posting a quarterly return of 1.6%. The underperformance was due to the short duration of bonds, rather than any stress.
In our previous note we projected volatility in yields, as the market struggles with the dueling narratives of inflation and recession. This was evident in February as the market began to price in a 6% Federal Funds rate, only to capitulate in March after stress hit the financial sector.
Regardless of the direction in yields, we expect the correlation between stocks and bonds to decrease, providing portfolios with more diversification benefit than we experienced in 2022.
Figure 9: U.S. Treasury Yields and 2/10 Spread

The U.S. Treasury curve remains inverted, which is a closely followed recessionary signal. In March, the Federal Reserve increased the Fed Funds rate by 25 bps to a range of 4.75-5%. In their Summary of Economic Projections, most Federal Reserve members projected a further 25 bps of increases by the end of 2023. The 2-year/10-year spread ended the quarter at (-55 bps) after falling as low as (-1.03%) in the quarter.
While the media tends to focus on the 2-year/10-year spread, it is actually the 3-month/10-year spread that has a perfect track record of predicting a recession. This spread went negative in October 2022 and currently sits at (-142 bps).
Figure 10: U.S. Corporate Credit Spreads
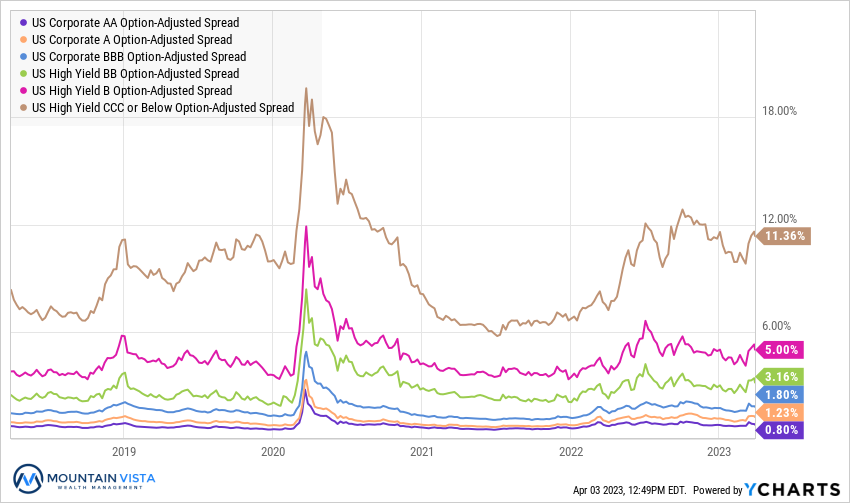
Corporate credit spreads rallied to start the year, but were largely unchanged by the end of the quarter. Despite the end of the quarter weakness, credit remains very resilient considering the trouble taking place in the banking sector.
Looking forward, expectations are for credit standards to tighten. This could result in higher default rates and credit spreads. The magnitude of the increase will largely depend on the strength or weakness of the economy.
CCC-rated bond spreads tightened by (-34 bps), while AA-rated bond spreads widened by
3 bps.
We continue to watch CCC spreads very closely. They are a key indicator of a faltering economy and recessionary risk. True periods of stress tend to see spreads gap wider in short order. Thus far, the movement of spreads has been very orderly.
CONCLUSION
Most investors were happy to say goodbye to 2022, and the market celebrated the new year with a strong rally in the 1st quarter. What is more impressive is that these gains came despite a mini financial crisis, continued rate hikes, and persistent market pessimism. This is a reminder to stay humble in your investment opinions and supports that argument against trying to time the market.
Also, it is important to remember that today’s news is mostly reflected in current valuations. The market is trying to anticipate the world 3-6 months forward. While the Federal Reserve is still hiking, they are expected to pause in the coming months. While recession is on everyone’s mind, economic data has been resilient.
Given the pace and magnitude of the Federal Reserve’s tightening in the last 12 months, we would not be surprised to see more accidents along the way in 2023. We remain diligently focused on preserving our clients’ capital, so we can take advantage of the opportunity once the cycle changes.
Thank you all for your continued support! We are dedicated to helping you navigate this uncertain time and are constantly looking for ways to improve the risk-reward profile of your investment portfolio.
Sincerely,
Jonathan R. Heagle, CFP®, CFA
President and Chief Investment Officer
Disclaimer
The views and opinions expressed are for informational and educational purposes only as of the date of writing and may change at any time based on market or other conditions and may not come to pass. This material is not intended to be relied upon as investment advice or recommendations, does not constitute a solicitation to buy or sell securities and should not be considered specific legal, investment or tax advice. The information provided does not take into account the specific objectives, financial situation, or particular needs of any specific person. All investments carry a certain degree of risk and there is no assurance that an investment will provide positive performance over any period of time. Equity investments are subject to market risk or the risk that stocks will decline in response to such factors as adverse company news or industry developments or a general economic decline. Debt or fixed income securities are subject to market risk, credit risk, interest rate risk, call risk, tax risk, political and economic risk, and income risk. As interest rates rise, bond prices fall. Non-investment-grade bonds involve heightened credit risk, liquidity risk, and potential for default. Foreign investing involves additional risks, including currency fluctuation, political and economic instability, lack of liquidity and differing legal and accounting standards. These risks are magnified in emerging markets. Past performance is no guarantee of future results.