
INTRODUCTION
“Time in the market beats timing the market…”
– Ken Fisher
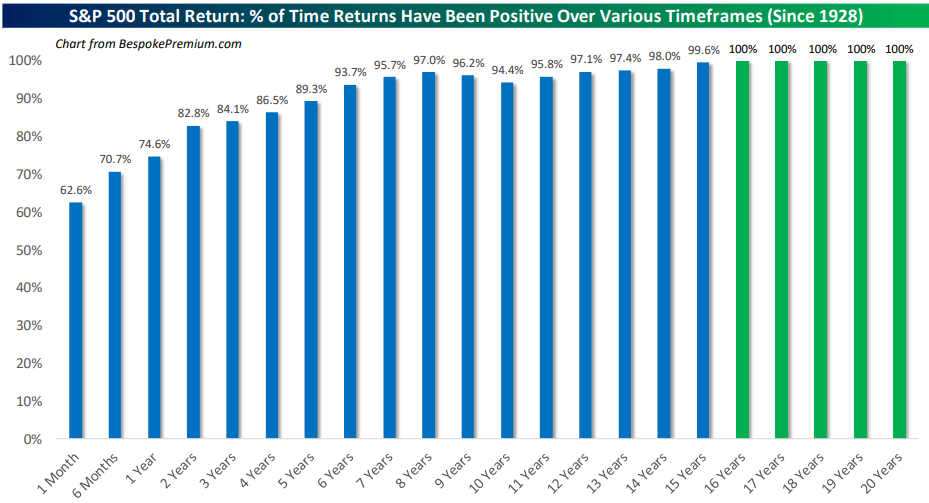
As investors, we acknowledge the inherent complexity and unpredictability of financial markets. Humility and flexibility are virtues that serve us well. Even the most seasoned traders hope to be correct only around 60% of the time – a sobering reminder of the challenges we face.
Amidst this uncertainty, two strategies have successfully delivered for stock investors: diversification and patience. By diversifying our holdings across various companies and industries, we mitigate concentration risk and increase our chances of capturing opportunities wherever they may arise. Furthermore, embracing a long-term investment horizon has historically yielded favorable outcomes.
While the stock market’s day-to-day movements may resemble a coin flip, extending our time horizon substantially increases the odds of achieving positive returns. Historically, the S&P 500 has delivered positive returns approximately 75% of the time over one-year periods, an impressive 97% over seven years, and an unwavering 100% over 16-year spans.
Sincerely,
Jonathan R. Heagle, CFP®, CFA
President and Chief Investment Officer
QUARTERLY ROUNDUP
In the first quarter of 2024, stocks continued their upward march, with the S&P 500 returning 10.6% and the Nasdaq 100 up 8.5%. The Russell 2000 small-cap index lagged at 5.2% for the quarter, but has gained 30.7% since late October 2023, outperforming large-caps by about 2% over that stretch. The positive bias to equities was in line with our expectations coming into the year.
Figure 1: U.S. Equity Indices Total Return

While large-capitalization technology companies like Nvidia garnered significant media attention and drove a substantial portion of the market gains in 2023, the first quarter of 2024 has witnessed a much broader participation across sectors. Energy, Financials, Materials, and Industrials are trading at or near 52-week highs, outpacing the Technology sector. This diversified strength underscores the importance of maintaining a well-diversified portfolio to capture opportunities across various market segments.
Defensive and rate sensitive sectors, such as Real Estate and Utilities, have lagged as the economy remained resilient, pushing yields higher. Surprisingly, Consumer Discretionary was the second weakest sector, despite the strong economy. This weakness was driven by its exposure to Tesla, rather than due to any weakness in the consumer. Tesla is down (-29%) year-to-date on weakness in China and declining profit margins. Amazon, on the other hand, returned 19% in the 1st quarter. No problem there!
With Apple and Tesla down (-13%) and (-40%) from their respective 2023 highs, it is impressive that the rest of the market has been able to pick up the slack, driving the indices higher. Clearly the market is not exclusively relying on the “Magnificent 7” stocks anymore.
Figure 2: U.S. Equity Sector Total Return

Good News is Good News…For Now
At a high level, the strength in the equity market was driven by the combination of a persistently strong U.S. economy and expectations that the Federal Reserve will be lowering rates at some point in 2024. Thus far, the market has celebrated this economic strength, but there is a risk on the horizon that strong growth could lead to renewed concerns about inflation, extending the tight monetary environment.
Inflation data was surprisingly strong in January and February, largely driven by a 5% annualized increase in rents ex hotels, which have a 43.5% weighting in core CPI. Auto insurance, air travel, and car rentals were also major contributors to the higher inflation reading.
While the equity market and the Federal Reserve have both shown a willingness to look through this “sticky” inflation, their patience may be tested should higher readings persist.
Figure 3: Core CPI ex Rent Annualized
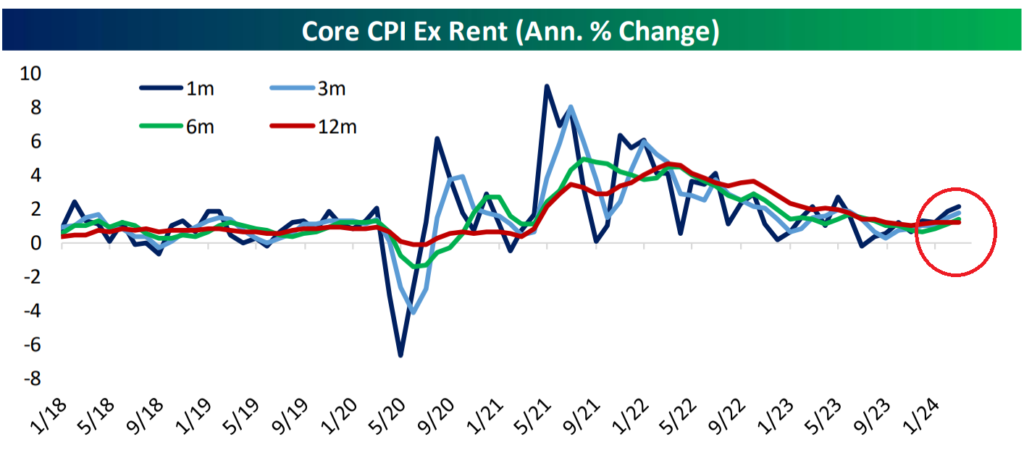
Source: Bespoke Investment Group
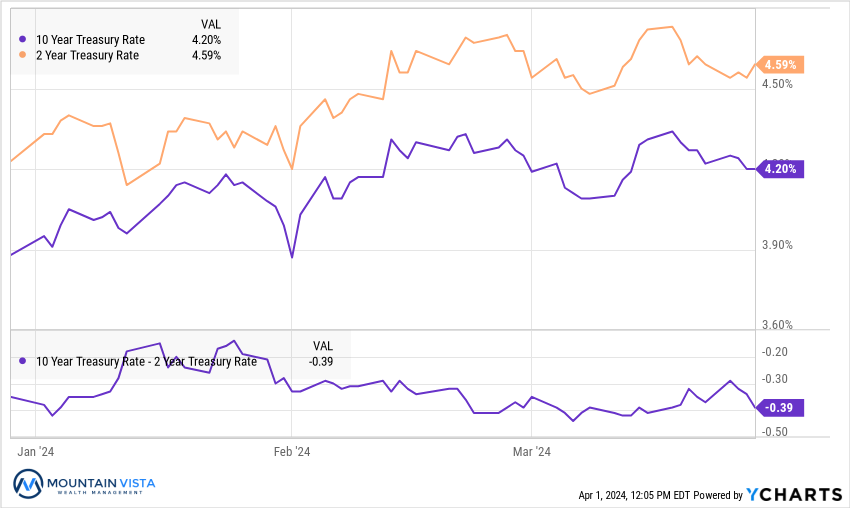
Fixed income’s performance in the 1st quarter was mixed. After rallying from over 5% to 3.9% in the 4th quarter of 2023, the yield on the 10-year U.S. Treasury bond has steadily drifted higher over the 1st quarter, settling at 4.2%. Higher yields result in lower bond prices, so longer dated bonds saw negative returns over the quarter.
High Yield and Emerging Market bonds produced positive returns, as their coupon payments and tightening of credit spreads outweighed the increase in benchmark yields.
Figure 4: Fixed Income ETF Total Return
| ETF | Description | Q1 2024 Total Return | Since October 27, 2023 | 2023 Total Return |
| AGG | Aggregate Bond | (0.7%) | 7.3% | 5.7% |
| BND | Total Bond Market | (0.7%) | 7.2% | 5.7% |
| LQD | IG Corporate | (0.9%) | 11.4% | 9.4% |
| JNK | HY Corporate | 1.6% | 10.5% | 12.4% |
| EMB | $ EM Bonds | 1.6% | 13.1% | 10.6% |
| SHY | 1-3 Yr Treasuries | 0.3% | 2.4% | 4.2% |
| IEF | 7-10 Yr Treasuries | (1.3%) | 6.5% | 3.6% |
| TLT | 20+ Yr Treasuries | (3.7%) | 14.0% | 2.8% |
| TIP | TIPs | (0.1%) | 4.8% | 3.8% |
Fed Dovishness Surprises the Market
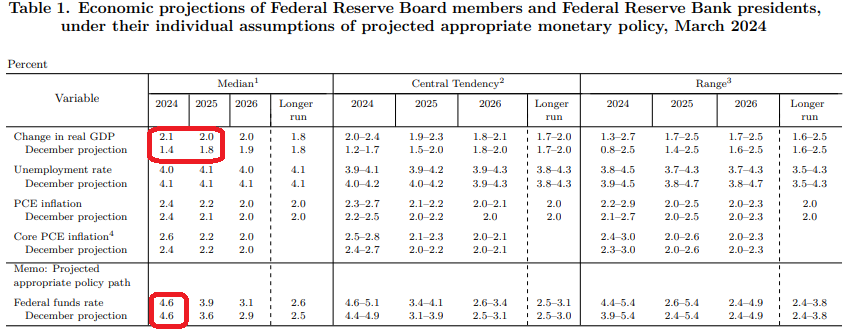
The Federal Reserve Open Market Committee (FOMC) met March 19-20th and left the Federal Funds rate unchanged at 5.25% to 5.5%. During this meeting they also released their latest Summary of Economic Projections. As you can see in Figure 5, they upgraded expected GDP growth and 2024 inflation expectations, but forecast the same ending Federal Funds rate of 4.6%. Also, during Chair Powell’s speech, he suggested that rate cuts could begin before seeing evidence of weakness in the employment market. Taken together, this was much more accommodative than many expected.
Figure 5: Federal Reserve’s Summary of Economic Projections March 2024
Bitcoin ETFs Begin Trading and See Major Inflows
On January 5th, the newly approved Bitcoin ETFs began trading. Bulls expecting the ETFs to bring more investors into the asset class pushed the price of Bitcoin up ~50% leading up to the commencement of trading. As you can see in Figure 6, there was an initial “sell the news” dip after the ETFs began trading, but evidence of strong inflows into the new ETFs kicked off another ~50+% of appreciation.
Figure 6: BITO (Bitcoin Futures ETF) versus QQQ and GLD (1 Year Returns)
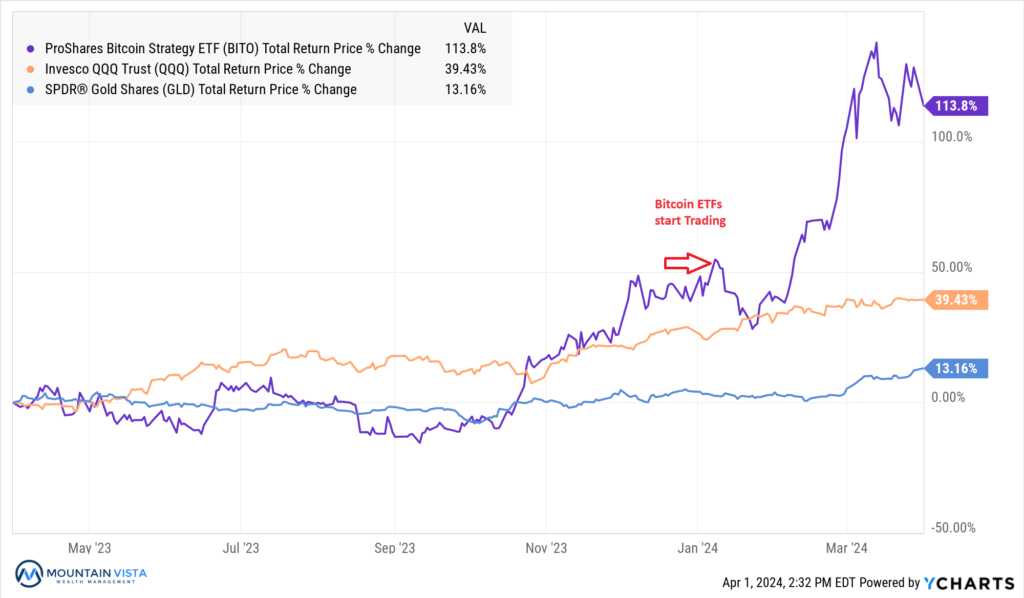
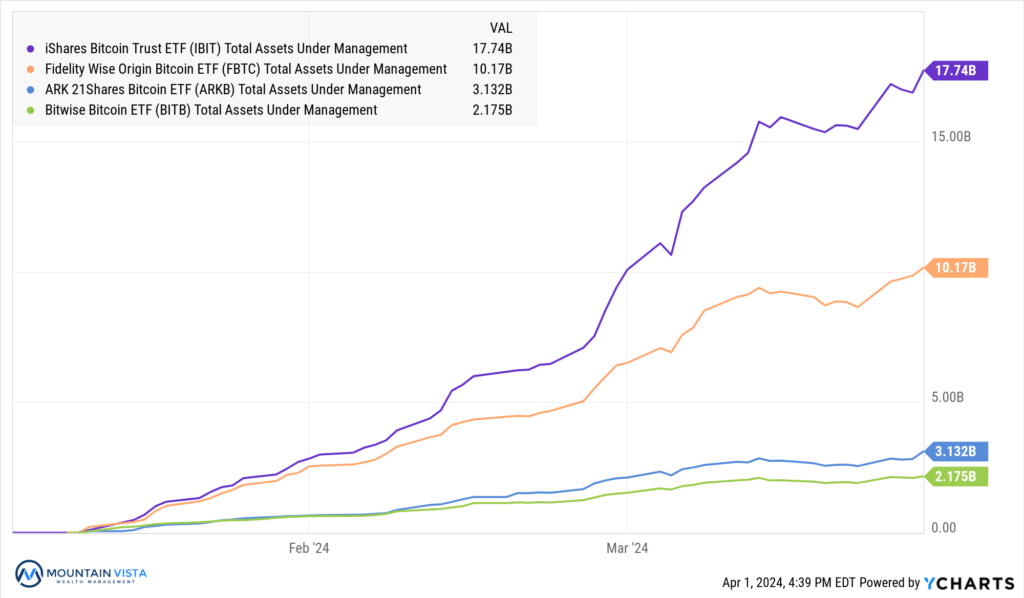
The assets under management of the top 4 new Bitcoin ETFs ended the quarter north of $33 billion. While some of this capital likely flowed from existing products, such as GBTC and BITO, these ETFs have exceeded expectations. Blackrock’s IBIT and Fidelity’s FBTC are the clear winners, accounting for $28 of the $33 billion. I expect these numbers to continue to grow, as investment advisors get more comfortable adopting the ETFs into their model portfolios over time.
Figure 7: Top 4 Bitcoin ETFs Total Assets Under Management
Keep Your Politics and Your Investments Separate
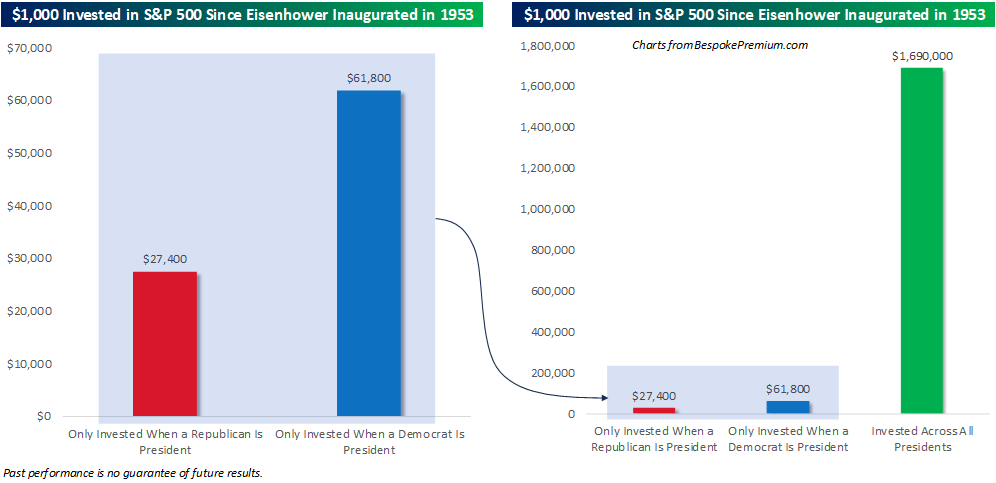
With the Presidential election fast approaching, we wanted to take a moment to remind everyone that politics and investing do not mix. Historically, the S&P 500 has experienced meaningful gains during both Republican and Democratic Presidential terms and median annualized returns are comparable. The most harmful thing an investor can do is interrupt the compounding of their money by exiting the market. Stay invested, even if you dislike the outcome of the election!
Figure 8: Growth of $1000 Invested in the S&P 500 During Presidential Terms
Looking Ahead…
The stock market has staged a tremendous run over the last 18 months and we are starting to see speculative activity pick up again. Technical indicators point towards an overbought market and complacent investor. For that reason, we would not be surprised to see a correction in the coming months. We are not chasing the stock market here and favor a balanced approach.
Fixed income looks fairly valued, but we are concerned that long-term rates could head higher should inflation prove problematic in the next few months.
Despite these near-term concerns, the economy remains strong and the consumer is still in great shape, so any correction should not be too problematic. Thank you for taking the time to read this letter! Please reach out if you would like to discuss anything in more detail.
APPENDIX
Equity Index ETF Total Return
| ETF | Description | Q1 2024 Total Return | Since October 27, 2023 | 2023 Total Return |
| SPY | S&P 500 | 10.4% | 28.3% | 26.2% |
| QQQ | Nasdaq 100 | 8.6% | 29.1% | 54.9% |
| IWM | Russell 2000 | 5.0% | 30.5% | 16.8% |
| IVW | S&P 500 Growth | 12.5% | 28.9% | 29.8% |
| IVE | S&P 500 Value | 7.9% | 27.7% | 22.1% |
| VXUS | International Ex-US | 4.4% | 20.3% | 15.9% |
| IEMG | Emerging Markets | 2.0% | 15.0% | 11.5% |
U.S. Equity Sector Total Return
| ETF | Description | Q1 2024 Total Return | Since October 27, 2023 | 2023 Total Return |
| XLE | Energy | 13.5% | 13.5% | (0.6%) |
| XLC | Communications | 12.7% | 30.1% | 52.8% |
| XLF | Financials | 12.4% | 35.1% | 12.0% |
| XLI | Industrials | 10.8% | 31.7% | 18.1% |
| XLB | Materials | 9.0% | 25.3% | 12.5% |
| XLV | Healthcare | 8.7% | 20.9% | 2.1% |
| XLK | Technology | 8.4% | 29.8% | 56.0% |
| XLP | Consumer Staples | 6.8% | 16.4% | (0.8%) |
| XLU | Utilities | 4.5% | 13.8% | (7.2%) |
| XLY | Consumer Disc | 3.1% | 23.4% | 39.6% |
| XLRE | Real Estate | (0.7%) | 24.3% | 12.4% |
| IYZ | Telecom | (2.8%) | 11.8% | 3.9% |
U.S. Equity Sector Total Return

Global Equity ETF Total Return
Fixed Income ETF Total Return
| ETF | Description | Q1 2024 Total Return | Since October 27, 2023 | 2023 Total Return |
| AGG | Aggregate Bond | (0.7%) | 7.3% | 5.7% |
| BND | Total Bond Market | (0.7%) | 7.2% | 5.7% |
| LQD | IG Corporate | (0.9%) | 11.4% | 9.4% |
| JNK | HY Corporate | 1.6% | 10.5% | 12.4% |
| EMB | $ EM Bonds | 1.6% | 13.1% | 10.6% |
| SHY | 1-3 Yr Treasuries | 0.3% | 2.4% | 4.2% |
| IEF | 7-10 Yr Treasuries | (1.3%) | 6.5% | 3.6% |
| TLT | 20+ Yr Treasuries | (3.7%) | 14.0% | 2.8% |
| TIP | TIPs | (0.1%) | 4.8% | 3.8% |
U.S. Treasury Yields and 2/10 Spread
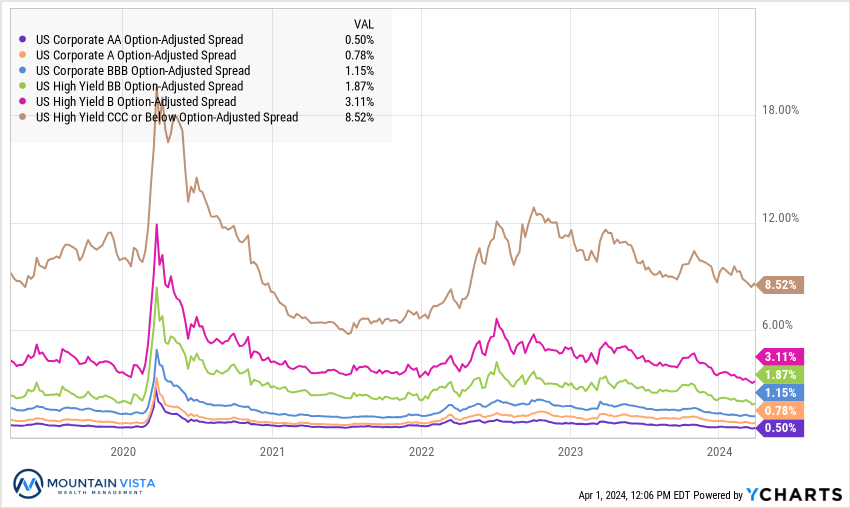
U.S. Corporate Credit Spreads
Commodity and Bitcoin Total Return
| ETF | Description | Q1 2024 Total Return | Since October 27, 2023 | 2023 Total Return |
| PDBC | Diversified | 4.3% | (3.6%) | (6.2%) |
| GLD | Gold | 7.6% | 10.5% | 12.7% |
| DBB | Base Metals | (1.9%) | 5.3% | 1.1% |
| USO | Oil | 18.1% | 0.5% | (4.9%) |
| BITO | Bitcoin | 64.5% | 101.4% | 137.3% |
Disclaimer
The views and opinions expressed are for informational and educational purposes only as of the date of writing and may change at any time based on market or other conditions and may not come to pass. This material is not intended to be relied upon as investment advice or recommendations, does not constitute a solicitation to buy or sell securities and should not be considered specific legal, investment or tax advice. The information provided does not take into account the specific objectives, financial situation, or particular needs of any specific person. All investments carry a certain degree of risk and there is no assurance that an investment will provide positive performance over any period of time. Equity investments are subject to market risk or the risk that stocks will decline in response to such factors as adverse company news or industry developments or a general economic decline. Debt or fixed income securities are subject to market risk, credit risk, interest rate risk, call risk, tax risk, political and economic risk, and income risk. As interest rates rise, bond prices fall. Non-investment-grade bonds involve heightened credit risk, liquidity risk, and potential for default. Foreign investing involves additional risks, including currency fluctuation, political and economic instability, lack of liquidity and differing legal and accounting standards. These risks are magnified in emerging markets. Past performance is no guarantee of future results.