
INTRODUCTION
“The markets take the stairs up and the elevator down.”
– Tim Egart
While the stock market has historically delivered impressive 9-10% long-term returns, many investors fail to capture these gains. When market conditions deteriorate, prices adjust rapidly, making it challenging to exit declining positions during negative news cycles. More critically, selling after a market decline can erase years of accumulated wealth.
Consider this scenario: An investor with $100,000 earning 10% annually would accumulate $161,051 after five years. However, if the market drops 15% in the sixth year and they sell everything, their annualized return plummets to just 5.37% before taxes, and merely 4.65% after accounting for a 15% long-term capital gains tax.
Market “corrections”—defined as declines of 10% or more—occur approximately every other year. Since 1974, investors have weathered 27 such corrections, with six developing into full “bear markets” (declines exceeding 20%). While we cannot predict whether the current correction will deepen into a bear market, history consistently shows that markets eventually recover, offering better selling opportunities for those who remain patient.
During market downturns, media coverage, social pressure, and emotional reactions will tempt you to sell. Resist this impulse and adhere to your investment strategy. The optimal time to sell is BEFORE a correction begins. A robust financial plan ensures you have sufficient liquidity to endure difficult market periods. Strategic allocations to cash and bonds can provide stability while you wait for more favorable conditions to adjust your stock positions.
If you are feeling uncomfortable with the recent market movements, please reach out to your financial advisor to reassess your risk tolerance.
Sincerely,
Jonathan R. Heagle, CFP®, CFA
President and Chief Investment Officer
QUARTERLY ROUNDUP
Market Performance Overview
The new year launched with remarkable momentum as equity markets posted substantial gains through mid-quarter. By February 19th, the S&P 500 had climbed 4.6%, while the technology-heavy Nasdaq 100 outperformed with a 5.5% advance.
Market sentiment was overwhelmingly dominated by optimism surrounding the new administration’s anticipated business-friendly policies. Notably, investors largely dismissed discussions of potential tariffs as mere negotiating strategy rather than serious policy intentions. The prevailing view in financial circles maintained that actual tariff implementation remained highly improbable.
Figure 1: Index and Big Tech Total Returns
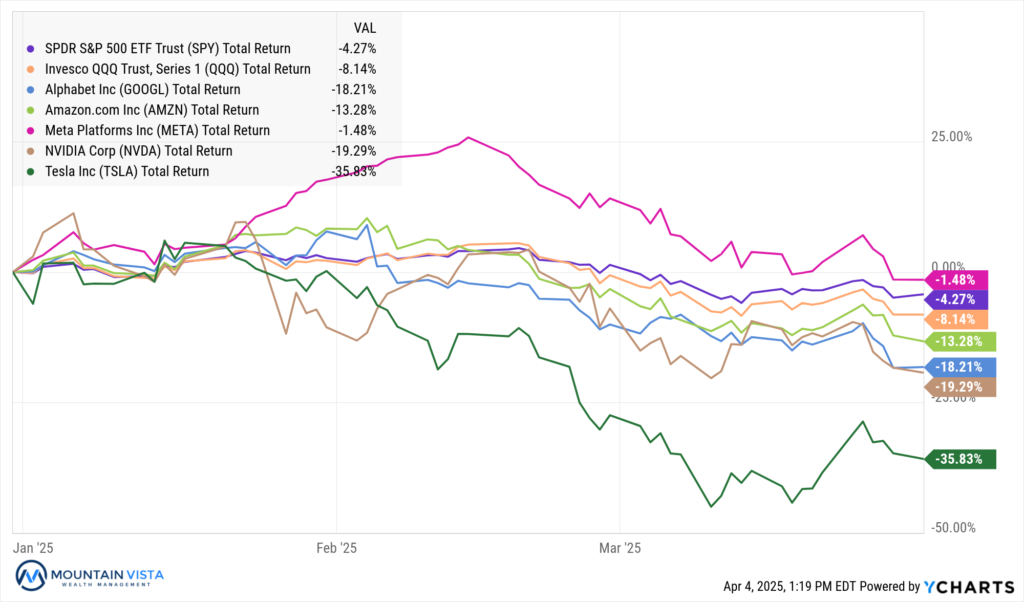
On February 27th, President Trump’s firm announcement that tariffs on Mexico, Canada, and China would proceed as scheduled the following week forced investors to confront economic realities they had previously dismissed. The market reaction was swift and severe. Over the subsequent two weeks, the S&P 500 plunged (-7%) while the Nasdaq 100 tumbled (-8%), bringing their peak-to-trough declines to (-10%) and (-13%), respectively.
While the broader indices entered correction territory (defined as a decline of 10% or more), several high-profile growth stocks experienced significantly steeper losses:
- Alphabet, Amazon, and Meta each saw their market values plummet approximately (-20%)
- Nvidia suffered a precipitous (-28%) drop
- Tesla endured the most dramatic decline, with shares losing nearly half their value
Tesla’s exceptional weakness stemmed from a perfect storm of negative factors: not only was the company vulnerable to the newly implemented tariffs, but it also faced intense public backlash regarding CEO Elon Musk’s involvement in the administration’s controversial DOGE initiative.
Diversification is Alive and Well
Recent years saw many investors questioning diversification’s relevance during the extended U.S. tech-dominated bull market. As American technology giants delivered exceptional returns, allocations to international markets often appeared superfluous or even counterproductive. The case for diversification was further challenged in 2022 when rising interest rates created an unusual environment where bonds failed to provide their traditional protective function during equity market declines.
However, 2025’s market volatility serves as a compelling reminder of why diversification remains fundamental to prudent investment strategy. The swift market correction triggered by tariff implementation has demonstrated that even dominant sectors can experience rapid reversals. While high-flying tech names suffered disproportionate losses, properly diversified portfolios have weathered the storm with significantly less turbulence.
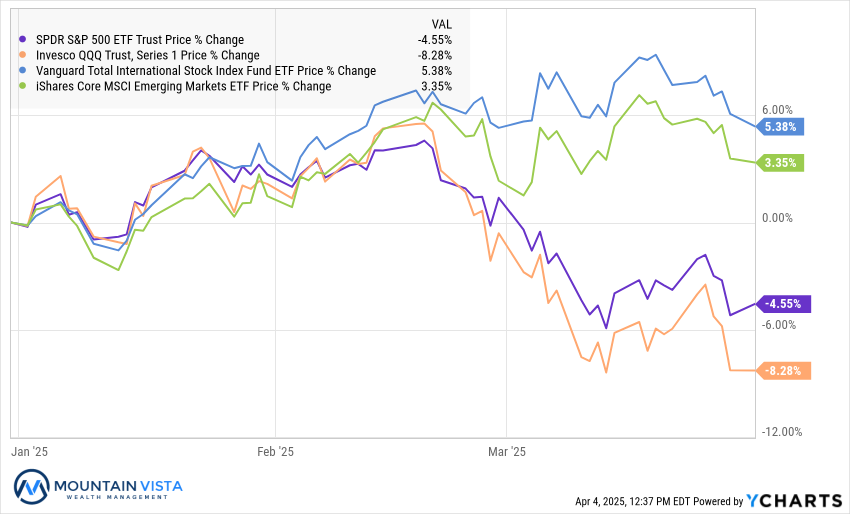
Figure 2: Comparison of Returns Across Diverse Holdings
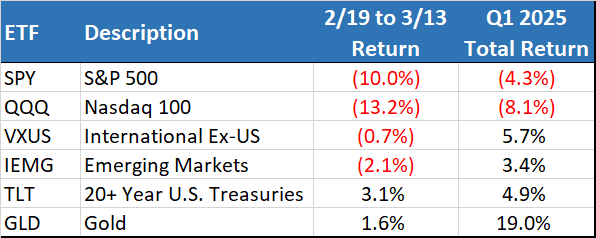
Geographic Diversification Pays Off: While U.S. markets have struggled, international and emerging markets have demonstrated remarkable resilience, and are close to their year-to-date highs.
Fixed Income Provides Balance: As economic concerns have grown, yields have declined, boosting bond prices. Longer-dated Treasuries and broad fixed income indexes have delivered positive returns, providing essential stability during the equity volatility.
Alternative Assets Shine: Gold emerged as a standout performer in 2024 and has built on those gains with a 12% year-to-date return, reinforcing its reputation as a portfolio hedge during uncertain times.
Market Performance Following Fast Falls from 52-Week Highs (Since 1950)
The stock market’s recent plunge into correction territory was remarkably swift, occurring in just 20 days. As illustrated in Figure 3, this 20-day timeframe ties with the “Volcker Shock” of 1979 and the “Asian Financial Crisis” of 1997 for the fifth-fastest descent from a 52-week high to correction territory since 1950.
This historical context provides valuable perspective for investors. Past instances of similarly rapid market corrections have consistently yielded strong subsequent performance. Following these swift declines, markets have historically delivered positive returns over the following 3-month, 6-month, and 12-month periods 100% of the time.
Figure 3: Rapid Corrections from 52-Week Highs
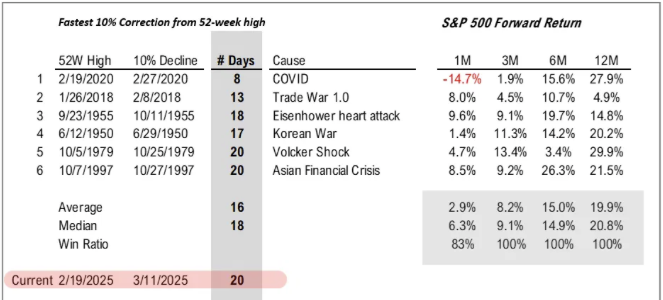
Source: Fundstrat
While historical patterns never guarantee future outcomes, this perfect track record of recovery following rapid corrections offers a compelling data point for long-term investors. The current market environment, despite its immediate volatility, shares important characteristics with previous episodes that ultimately rewarded patient capital.
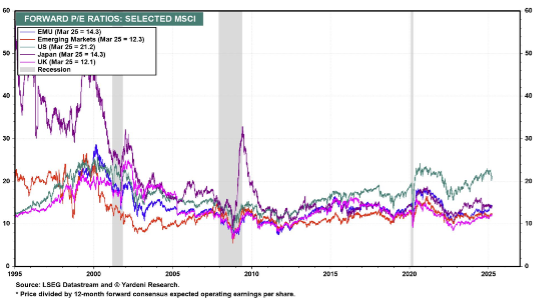
S&P 500 Valuations vs. the World
At the start of 2025, we highlighted that U.S. equities were trading at elevated valuation levels, particularly when compared with international and emerging market stocks. While the recent market correction has begun to narrow this valuation gap through the compression of forward price-to-earnings ratios, our analysis suggests there remains potential for further adjustment.
However, it’s important to recognize that valuation differentials aren’t solely indicative of mispricing. A significant portion of the disparity stems from fundamental market composition differences. The U.S. market features a substantially higher concentration of rapidly growing technology companies that justifiably command premium valuations. These higher-growth businesses naturally trade at elevated PE ratios compared to the value-oriented sectors that comprise larger portions of international indices.
Figure 4: Forward Price-to-Earnings Ratios of Various Countries’ Equity Markets
The Federal Reserve Takes a “Wait and See” Approach
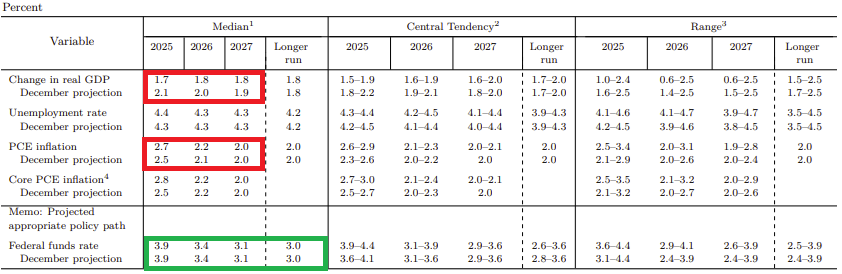
The Federal Reserve Board held rates steady at 4.25%-4.5% when they met on March 19th. While rates were held steady, they announced that they will be slowing the reduction of Treasury securities holdings from $25 billion to $5 billion per month. The monthly redemption cap of agency debt and agency mortgage-backed securities will remain at $35 billion.
The Fed also released their updated Summary of Economic Projections. As you can see in the table below, the median response resulted in an increase in inflation expectations and a decrease in economic growth. While the Fed is not pre-emptively changing policy in reaction to uncertain trade policies, tariff concerns may be reflected in these projections.
Looking Forward
The current investment landscape is characterized by heightened uncertainty, predominantly influenced by potential policy decisions from a single source. This uncertainty has begun to manifest in declining consumer and business confidence metrics, with potential to significantly impact the broader economy if substantial tariffs are implemented or if this period of policy ambiguity persists.
Despite recent underperformance, U.S. equities continue to trade at a notable premium compared to international markets and their long-term averages. This persistent valuation gap leaves U.S. stocks vulnerable to further relative weakness should market conditions deteriorate. Current pricing suggests investors remain optimistic that tariff threats represent negotiation tactics rather than definitive policy. Should this assumption prove incorrect, the S&P 500 could experience additional downside pressure.
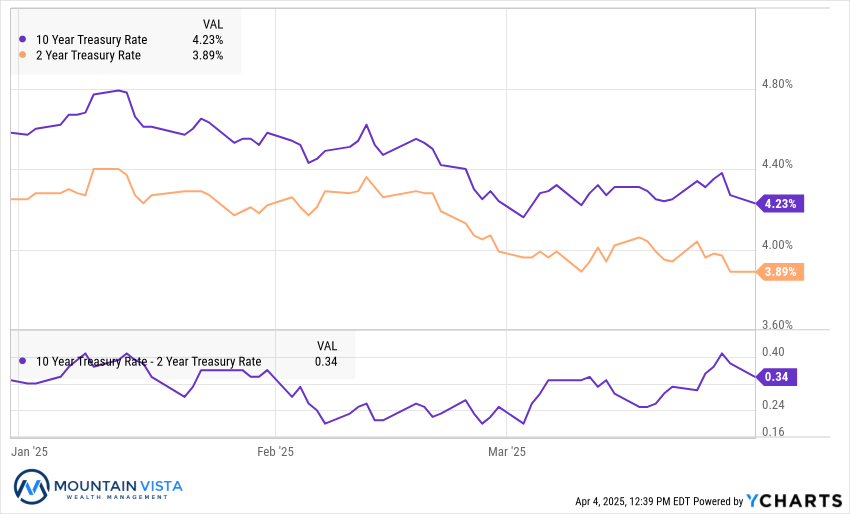
Fixed Income faces a complex environment. Tariffs should create near-term inflationary pressure, while simultaneously pushing growth lower. This challenging combination of stagnant growth with inflation pressures (“stagflation”) is influencing the yield curve in distinct ways. While the Federal Reserve maintains focus on inflation management, keeping short-term rates elevated, longer-term yields have been declining since their January peak. This trend has provided a positive backdrop for bond performance. U.S. Treasury securities, in particular, may offer valuable portfolio protection should tariff policies trigger economic contraction.
Gold continues to demonstrate strength amid prevailing uncertainties. Following two years of impressive appreciation, some consolidation would be reasonable to expect. Nevertheless, gold remains an attractive asset for global central banks and continues to provide effective diversification benefits within traditional stock and bond portfolios.
We appreciate your review of this analysis and welcome any questions regarding these observations or other financial matters of interest.
APPENDIX
Equity Index ETF Total Return
| ETF | Description | Q1 2025 Total Return | Since February 19, 2025 | 2024 Total Return |
| SPY | S&P 500 | (4.3%) | (8.5%) | 24.9% |
| QQQ | Nasdaq 100 | (8.1%) | (13.0%) | 25.6% |
| IWM | Russell 2000 | (9.5%) | (11.7%) | 11.4% |
| IVW | S&P 500 Growth | (8.5%) | (12.9%) | 35.8% |
| IVE | S&P 500 Value | 0.2% | (3.7%) | 12.0% |
| VXUS | International Ex-US | 5.7% | (0.9%) | 5.1% |
| IEMG | Emerging Markets | 3.4% | (2.2%) | 6.5% |
U.S. Equity Sector Total Return
| ETF | Description | Q1 2025 Total Return | Since February 19, 2025 | 2024 Total Return |
| XLE | Energy | 9.9% | 2.3% | 5.6% |
| XLV | Healthcare | 6.5% | 0.1% | 2.5% |
| XLU | Utilities | 4.9% | (1.1%) | 23.3% |
| XLP | Consumer Staples | 4.4% | 0.7% | 12.2% |
| XLRE | Real Estate | 3.6% | (0.4%) | 5.1% |
| XLF | Financials | 3.4% | (4.2%) | 30.6% |
| IYZ | Telecom | 2.7% | (3.5%) | 20.5% |
| XLB | Materials | 2.7% | (3.9%) | 0.2% |
| XLC | Communications | (0.1%) | (7.8%) | 34.7% |
| XLI | Industrials | (0.2%) | (5.3%) | 17.3% |
| XLK | Technology | (11.0%) | (14.6%) | 21.6% |
| XLY | Consumer Disc | (11.7%) | (12.5%) | 26.5% |
U.S. Equity Sector Total Return

Global Equity ETF Total Return
Fixed Income ETF Total Return
| ETF | Description | Q3 2024 Total Return | Since February 19, 2025 | 2024 Total Return |
| AGG | Aggregate Bond | 2.7% | 1.8% | 1.3% |
| BND | Total Bond Market | 2.4% | 1.5% | 1.4% |
| LQD | IG Corporate | 2.5% | 1.4% | 0.9% |
| JNK | HY Corporate | 0.9% | (0.9%) | 7.7% |
| EMB | $ EM Bonds | 2.7% | 0.4% | 5.5% |
| SHY | 1-3 Yr Treasuries | 1.6% | 1.1% | 3.9% |
| IEF | 7-10 Yr Treasuries | 3.8% | 2.9% | (0.6%) |
| TLT | 20+ Yr Treasuries | 4.9% | 3.5% | (8.1%) |
| TIP | TIPs | 4.3% | 2.4% | 1.7% |
U.S. Treasury Yields and 2/10 Spread
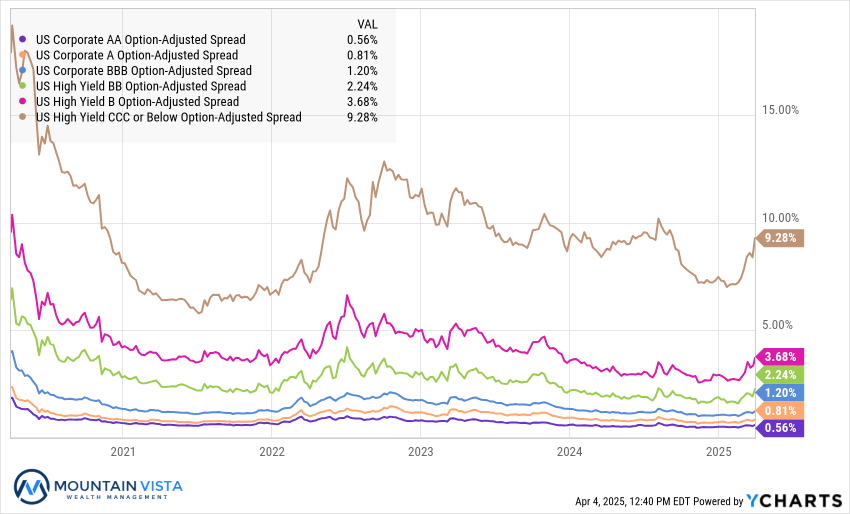
U.S. Corporate Credit Spreads
Commodity and Bitcoin Total Return
| ETF | Description | Q1 2025 Total Return | Since February 19, 2025 | 2024 Total Return |
| PDBC | Diversified Commodity | 4.9% | (2.2%) | 2.1% |
| GLD | Gold | 19.0% | 6.4% | 26.7% |
| DBB | Base Metals | 1.8% | (1.5%) | 7.9% |
| USO | Oil | 2.4% | (0.2%) | 13.4% |
| FBTC | Bitcoin* | (11.8%) | (14.3%) | 99.6% |
| * FBTC 2024 Total Return calculated from January 11, 2024 | ||||
Disclaimer
The views and opinions expressed are for informational and educational purposes only as of the date of writing and may change at any time based on market or other conditions and may not come to pass. This material is not intended to be relied upon as investment advice or recommendations, does not constitute a solicitation to buy or sell securities and should not be considered specific legal, investment or tax advice. The information provided does not take into account the specific objectives, financial situation, or particular needs of any specific person. All investments carry a certain degree of risk and there is no assurance that an investment will provide positive performance over any period of time. Equity investments are subject to market risk or the risk that stocks will decline in response to such factors as adverse company news or industry developments or a general economic decline. Debt or fixed income securities are subject to market risk, credit risk, interest rate risk, call risk, tax risk, political and economic risk, and income risk. As interest rates rise, bond prices fall. Non-investment-grade bonds involve heightened credit risk, liquidity risk, and potential for default. Foreign investing involves additional risks, including currency fluctuation, political and economic instability, lack of liquidity and differing legal and accounting standards. These risks are magnified in emerging markets. Past performance is no guarantee of future results.