
INTRODUCTION
“You can bomb the world into pieces, but you can’t bomb it into peace.”
– Michael Franti
War is always a tragedy, resulting in the loss of innocent lives and immeasurable suffering. In this letter we focus on the economic impacts of the war. We do not intend to downplay the human toll, but to focus on what we know best. We hope that a long-lasting, peaceful resolution is reached in an expeditious manner.
The economy entered 2026 with the wind at its back, and stock valuations reflected this positive backdrop. In our Q4 2025 letter, we instructed investors not to be complacent, extrapolating the strong returns of the prior two years forward. While we had no idea that the U.S. and Israel would attack Iran, we knew that a forward price-to-earnings multiple of 22-23 on the S&P 500 was historically high, leaving the market exposed to bad news.
Currently, the S&P 500 is only down (-4.4%) year-to-date and (-6.5%) from its recent highs. If the war drags on and the Strait of Hormuz, a critical waterway in the Persian Gulf, remains closed, it is likely that the market will remain under pressure. Alternatively, President Trump has repeatedly suggested that this will not be a drawn-out conflict. Should a resolution come to pass that allows for the price of oil to reverse most of its gains, the economy and market will likely recover. Unfortunately, Iran has a say in the matter too.
If you are in the accumulation phase of your retirement planning, this is likely to be yet another speed bump along way. For those approaching retirement or in retirement, it is worth checking to see if your portfolio still lines up with your risk tolerance. Stocks have produced large gains in the past few years leaving your portfolio overexposed to equities if you have not rebalanced.
We’re grateful to work with such thoughtful, engaged clients, and we never take your trust for granted. Thank you for allowing us the privilege of safeguarding your hard-earned savings.
Sincerely,
Jonathan R. Heagle, CFP®, CFA
President and Chief Investment Officer
QUARTERLY ROUNDUP
Market Performance Overview
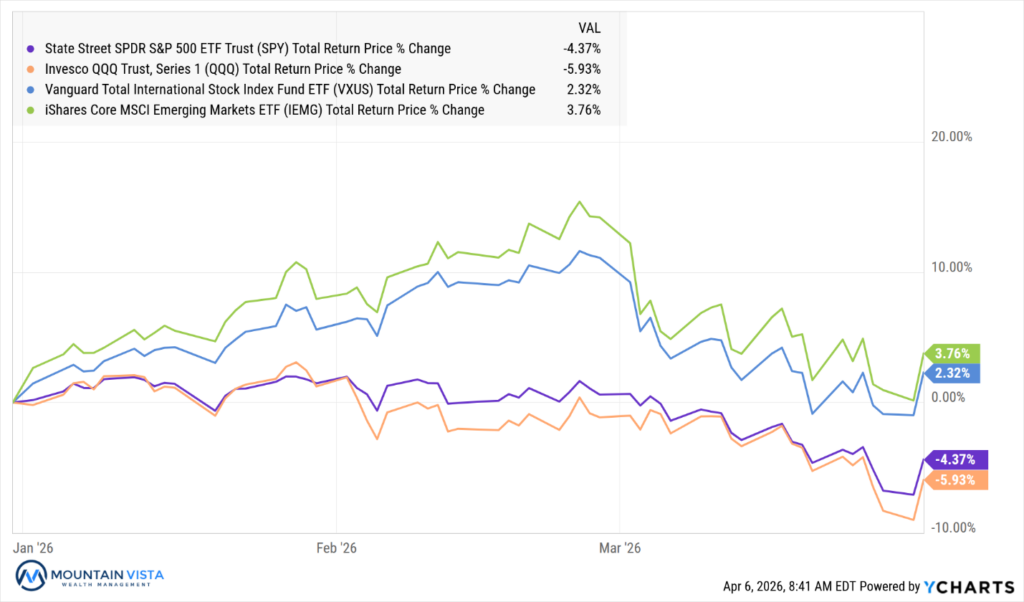
The first quarter of 2026 reflected a clear shift from early stability to a pronounced risk-off environment following the late-February escalation of the war with Iran. U.S. equities broadly declined, with the S&P 500 (SPY) falling (-4.4%) for the quarter and down (-5.9%) since February 25th. The Nasdaq 100 (QQQ) underperformed, dropping (-5.9%) in Q1 and (-6.3%) post-conflict, driven by weakness in growth-oriented names. Interestingly, small caps (IWM) held up better on a full-quarter basis, posting a modest 0.9% gain, though they fully participated in the selloff after the conflict began. Style dispersion was notable, with growth lagging value by 8.1%, though both cohorts declined meaningfully in the post-war period. International equities (VXUS +2.3%) and emerging markets (IEMG +3.8%) outperformed during the quarter, but this strength reversed sharply after February 25th, with both down 8–10%, highlighting a global de-risking trend and stronger dollar.
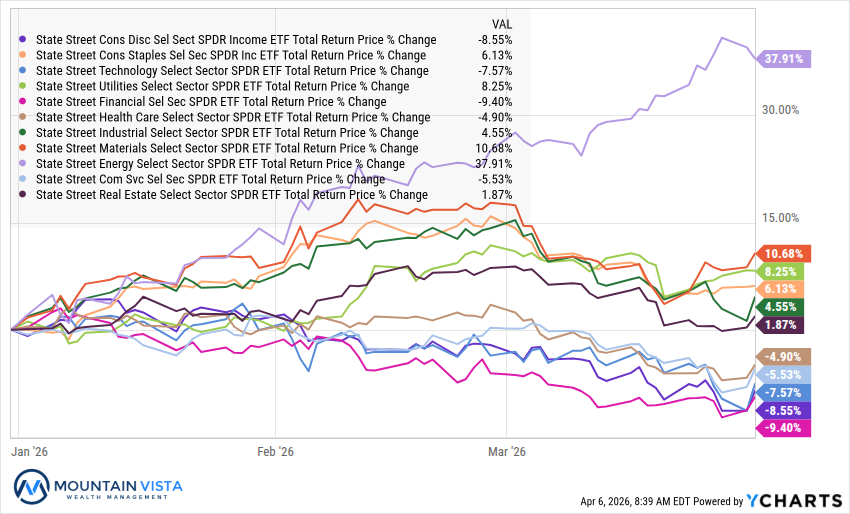
Sector performance in Q1 was dominated by a dramatic divergence between energy and the rest of the market. Energy (XLE) surged 37.9% during the quarter and continued to rally (+12.4%) after the conflict began, driven by a sharp spike in oil prices. Outside of energy, defensive and inflation-sensitive sectors such as telecom (IYZ +16.4%), materials (XLB +10.7%), and utilities (XLU +8.2%) performed relatively well in the 1st quarter. However, since the onset of the conflict, nearly all sectors have turned negative, including defensives like staples (XLP (-7.4%)) and utilities (-2.4%), suggesting broad-based risk reduction rather than selective rotation. Cyclical and growth-oriented sectors, such as technology, consumer discretionary, and financials, were among the weakest performers, reflecting concerns around slowing growth, tighter financial conditions, and elevated geopolitical risk.
Fixed income markets delivered muted performance in Q1 but deteriorated meaningfully following the geopolitical escalation. The Bloomberg Aggregate (AGG) was essentially flat for the quarter but declined (-1.4%) after February 25th, as rising inflation expectations pressured yields higher. Credit weakened, with investment-grade corporates (LQD (-2.0%)) and high yield (JNK (-1.4%)) declining amid widening spreads. Emerging market debt (EMB) was particularly hard hit, dropping (-3.5%) since the war began.
Commodities were the standout asset class in Q1, driven overwhelmingly by energy markets. Broad commodities (PDBC) gained 30.7% for the quarter and an additional 17.7% post-conflict, with oil (USO) surging an extraordinary 84.0% in Q1 and nearly 60% since February 25. This reflects supply shock concerns tied to the conflict and potential disruptions in global energy flows. Gold (GLD) rose 8.6% during the quarter, consistent with its role as a geopolitical hedge, but notably declined (-9.1%) after the conflict began, suggesting profit-taking or a shift toward cash and energy exposure. In contrast, cryptocurrencies struggled significantly, with Bitcoin (FBTC (-22.6%)) and Ethereum (ETHA (-29.4%)) sharply lower in the quarter, though performance stabilized somewhat after late February. This divergence underscores crypto’s continued sensitivity to liquidity conditions rather than acting as a consistent geopolitical hedge.
Overall, Q1 2026 marked a transition to a more inflationary and geopolitically driven market regime. The combination of sharply higher energy prices, declining equities, and weak fixed income performance suggests markets are grappling with stagflationary risks rather than a traditional growth slowdown. The post-conflict period has been characterized by broad-based selling across asset classes, with the notable exception of energy, indicating a generalized reduction in risk exposure rather than sector rotation. Going forward, market direction will likely hinge on the trajectory of the conflict, the persistence of elevated commodity prices, and central bank responses to renewed inflation pressures.
Inflation, Higher Yields and a Fed on Hold
From late 2025 into early 2026, inflation dynamics shifted meaningfully from a moderating trend to a more persistent and, in some respects, re-accelerating environment. As shown in the chart, headline CPI moved higher into early 2026 (approximately 3.4%), while core PCE, the Federal Reserve’s preferred measure, firmed to just over 3.0% after appearing to stabilize in the high-2% range late last year. Perhaps more notably, producer price inflation (PPI) exhibited renewed volatility and upward pressure, reinforcing the idea that pipeline cost pressures were rebuilding.
Figure 1: Various Measures of U.S. Inflation
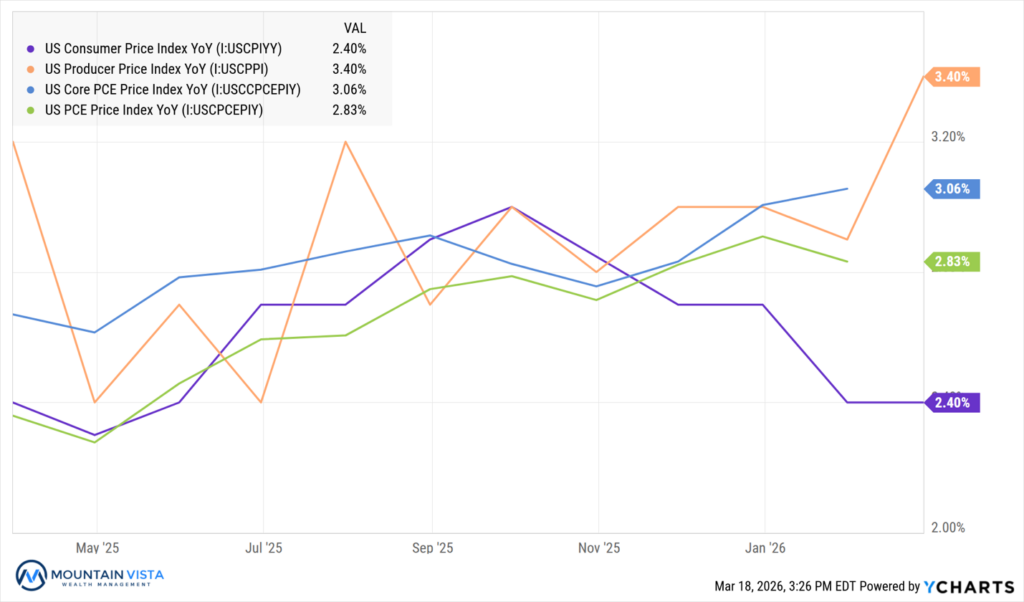
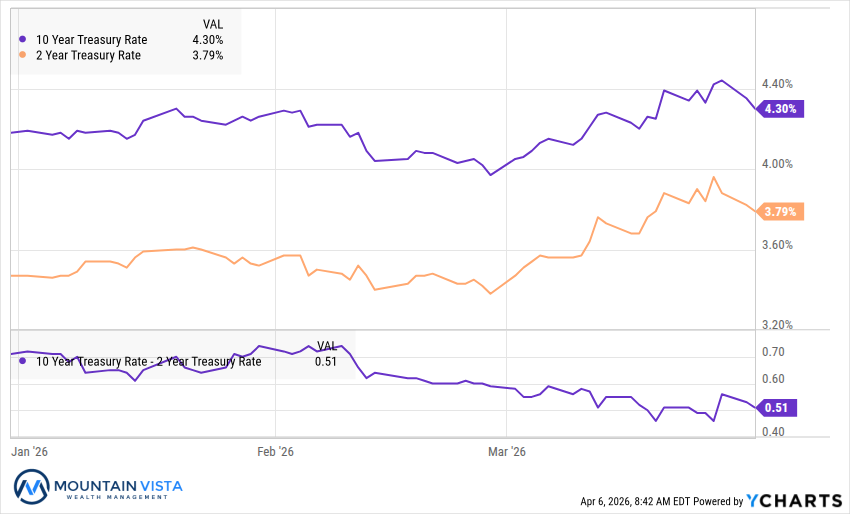
Against this backdrop, interest rates and yields adjusted higher as markets recalibrated expectations for both inflation and monetary policy. Treasury yields, particularly across the intermediate and long end of the curve, moved up in response to the realization that inflation may remain above target for longer. This repricing was already underway before the escalation of the war with Iran but was amplified by the surge in energy prices and renewed concerns about supply-side inflation pressures following late February.
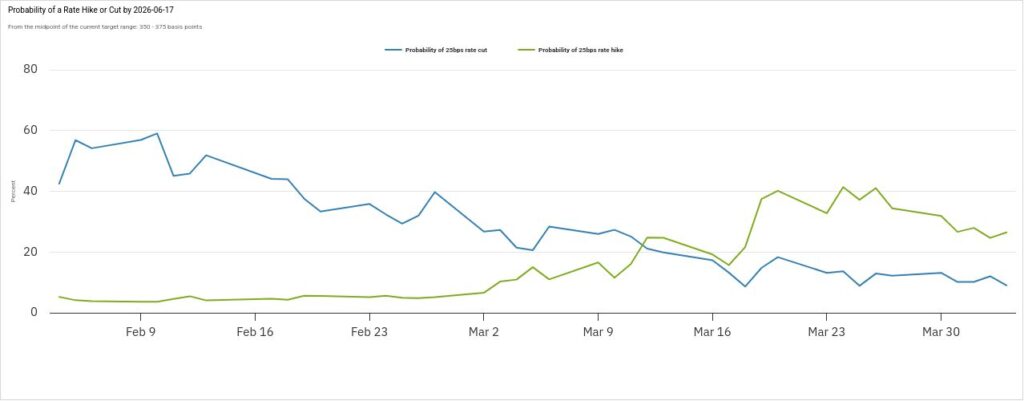
Furthermore, market expectations for Federal Reserve policy have shifted materially. Investors entered the year anticipating 2 to 3 rate cuts in 2026 and those expectations have been priced out. While it is not likely, in our opinion, the market has priced in some potential for rate hikes.
Figure 2: Probability of a Rate Hike or Cut by June 17, 2026
Private Credit & Software Collapse
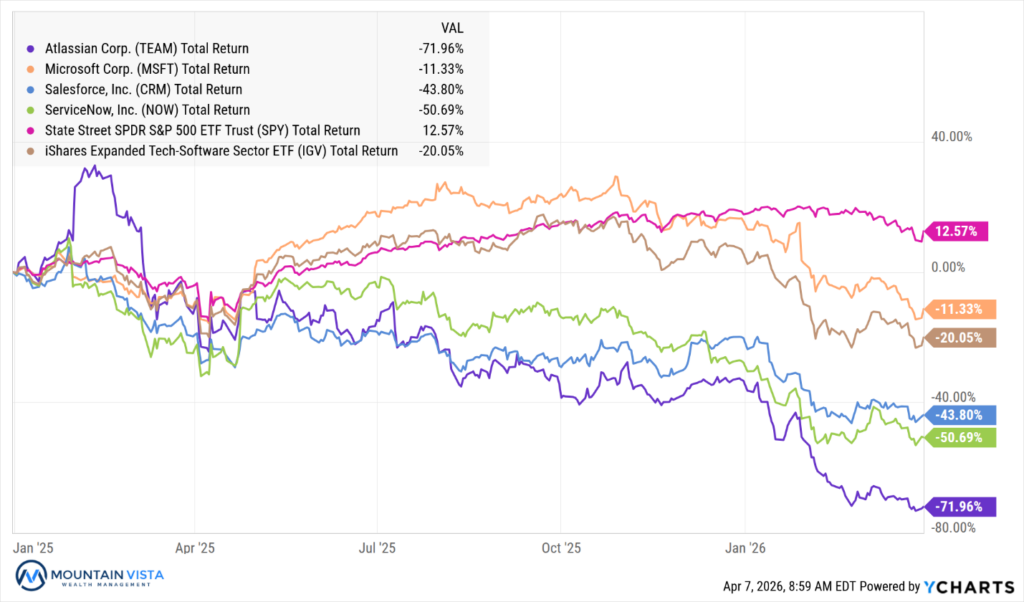
For the last decade, software companies have been a great investment. Low required capital investment, high margins and predictable growth produced high stock returns and high multiples. This narrative began to crack in 2025 for large enterprise software companies, such as Atlassian, Salesforce and ServiceNow. The culprit was artificial intelligence. The belief was that AI would make companies more efficient, requiring them to hire less people and therefore need to buy less software.
Also, Anthropic released their AI powered agent, Claude Code, which allowed users to create AI agents to create and execute code without human interaction. Furthermore, in January 2026, they released CoWork, which allowed non-technical users to access the power of Claude Code. This kicked off viral wave of “vibecoding”, where social media was flooded with examples of how these tools can automate tasks, ranging from organizing files to creating software.
People began to wonder: if AI powered agents can write customized software in hours, why would people pay so much for the enterprise software solutions? The selloff in software stocks picked up steam, despite no observable impact in their current earnings reports.
Figure 3: Software Stocks versus the S&P 500
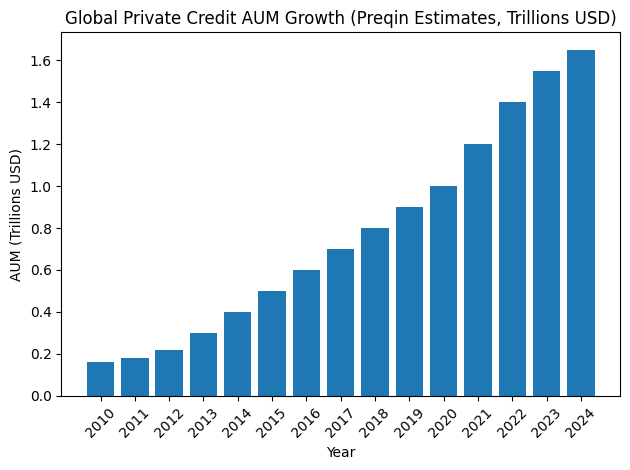
Since the Financial Crisis, Private Credit, or non-bank lending to private companies, grew substantially. The floating rate loans performed very well during the post-pandemic period of rising interest rates, attracting an influx of new money. Accelerating the growth in assets was the creation of limited liquidity investment vehicles allowing retail investors access through their investment advisors.
Figure 4: Growth of Private Credit Value
To date, the performance of Private Credit has been very strong, but many of these funds have software exposure from 20% to 30%. Investors are wondering how much the values of privately held software companies have fallen if large publicly traded companies are down 50% or more.
Like the performance of public companies, Private Credit has not had a fundamental problem, but many funds reached their quarterly redemption limits, typically 5%, and have limited investor withdrawals. These redemption limits are disclosed and are meant to protect investors from living through a fire sale, but I suspect not all advisors educated their clients on this feature appropriately.
The fund managers are downplaying the risk, but we are likely to see an uptick in defaults, continued redemptions, and a deterioration of the 10%+ historical returns that investors have earned to date.
The Shine Comes Off
Gold and silver entered 2026 after a powerful two-year rally, with gold rising sharply and silver significantly outperforming during the cycle. That momentum carried into early 2026 but reversed in the first quarter, as both metals corrected following increasingly crowded positioning and stretched sentiment. What had been a strong, momentum-driven trade quickly unwound as buyers stepped back and profit-taking accelerated.
Figure 5: Performance of Gold and Silver
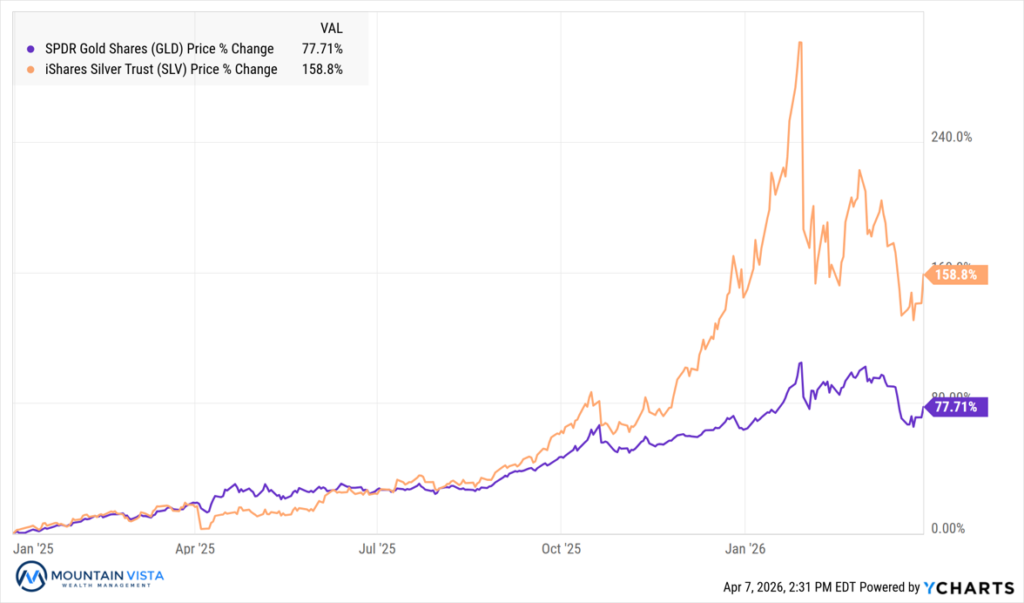
A key driver of the pullback was the shift in macro conditions, specifically a stronger U.S. dollar and rising real interest rates. As real yields moved higher and expectations for Fed rate cuts were pushed out, the opportunity cost of holding non-yielding assets like gold and silver increased. This change in rate expectations undermined one of the primary supports for the metals’ prior rally.
Finally, the correction was amplified by the growing popularity of metals as a retail and momentum trade. As participation broadened and positioning became more crowded, the market became more vulnerable to sharp reversals, with flows and sentiment driving near-term price action more than underlying fundamentals.
Looking Forward
While near-term market performance will likely be driven by how the conflict with Iran unfolds, we remain highly optimistic about the medium- to long-term outlook for equities. The pace of innovation today is unprecedented, and there is little reason to expect a meaningful slowdown in the years ahead.
Our optimism is grounded in several powerful structural trends. First, capital is increasingly being rewarded over labor as automation and technological adoption accelerate. Second, traditional industries such as materials and industrials are being revitalized as supply chains shift back toward the United States. Third, entirely new industries, including artificial intelligence, robotics, and space infrastructure, are emerging and scaling rapidly. Fourth, rising fiscal spending in Europe, particularly in defense, is creating an additional tailwind for global growth. Finally, after a period of market consolidation over the past six months, earnings growth has remained resilient, bringing forward price-to-earnings multiples back to more reasonable levels in the high teens.
Participating in these long-term economic gains requires maintaining exposure to equities. That said, markets are unlikely to move in a straight line. Periods of volatility are inevitable, particularly in uncertain geopolitical environments. Maintaining discipline and a long-term perspective will be essential to achieving strong real returns.
Fixed income may face more near-term headwinds. Persistent inflation over the coming quarters could limit central banks’ ability to ease policy, keeping yields elevated. At the same time, credit spreads remain relatively tight despite the stress in private credit. If a default cycle emerges, spreads could widen meaningfully, and tighter lending standards may reduce liquidity across the broader economy.
In commodities, the outsized gains in metals are likely behind us, though we continue to view gold as an important portfolio diversifier. Oil prices may remain elevated in the short term but are unlikely to sustain these levels over the medium term, presenting opportunities to realize gains. Bitcoin may be in the process of establishing a bottom; however, a sustained rally could depend on addressing longer-term security concerns, including those posed by advances in quantum computing.
We appreciate your review of this analysis and welcome any questions regarding these observations or other financial matters of interest. Happy new year! We wish you a happy, healthy and prosperous 2026.
APPENDIX
Equity Index ETF Total Return
| ETF | Description | Q1 2026 Total Return | Since February 25, 2026 Total Return | 2025 Total Return |
| SPY | S&P 500 | (4.4%) | (5.9%) | 17.7% |
| QQQ | Nasdaq 100 | (5.9%) | (6.3%) | 20.8% |
| IWM | Russell 2000 | 0.9% | (6.1%) | 12.7% |
| IVW | S&P 500 Growth | (8.2%) | (7.4%) | 21.9% |
| IVE | S&P 500 Value | (0.1%) | (4.4%) | 13.0% |
| VXUS | International Ex-US | 2.3% | (8.3%) | 32.3% |
| IEMG | Emerging Markets | 3.8% | (10.1%) | 32.6% |
U.S. Equity Sector Total Return
| ETF | Description | Q1 2026 Total Return | Since February 25, 2026 Total Return | 2025 Total Return |
| XLE | Energy | 37.9% | 12.4% | 7.9% |
| IYZ | Telecom | 16.4% | 0.3% | 29.3% |
| XLB | Materials | 10.7% | (5.4%) | 9.9% |
| XLU | Utilities | 8.2% | (2.4%) | 16.0% |
| XLP | Consumer Staples | 6.1% | (7.4%) | 1.5% |
| XLI | Industrials | 4.6% | (7.6%) | 19.3% |
| XLRE | Real Estate | 1.9% | (5.4%) | 2.6% |
| XLV | Healthcare | (4.9%) | (6.7%) | 14.5% |
| XLC | Communications | (5.5%) | (4.5%) | 23.1% |
| XLK | Technology | (7.6%) | (7.0%) | 24.6% |
| XLY | Consumer Disc | (8.6%) | (6.7%) | 7.4% |
| XLF | Financials | (9.4%) | (4.3%) | 14.9% |
U.S. Equity Sector Total Return
Global Equity ETF Total Return
Fixed Income ETF Total Return
| ETF | Description | Q1 2026 Total Return | Since February 25, 2026 Total Return | 2025 Total Return |
| AGG | Aggregate Bond | 0.0% | (1.4%) | 7.2% |
| BND | Total Bond Market | 0.1% | (1.4%) | 7.1% |
| LQD | IG Corporate | (0.4%) | (2.0%) | 7.9% |
| JNK | HY Corporate | (0.4%) | (1.4%) | 8.8% |
| EMB | $ EM Bonds | (1.6%) | (3.5%) | 13.9% |
| SHY | 1-3 Yr Treasuries | 0.3% | (0.3%) | 5.0% |
| IEF | 7-10 Yr Treasuries | (0.1%) | (1.7%) | 8.0% |
| TLT | 20+ Yr Treasuries | 0.2% | (3.3%) | 4.2% |
| TIP | TIPs | 0.4% | (0.9%) | 6.8% |
U.S. Treasury Yields and 2/10 Spread
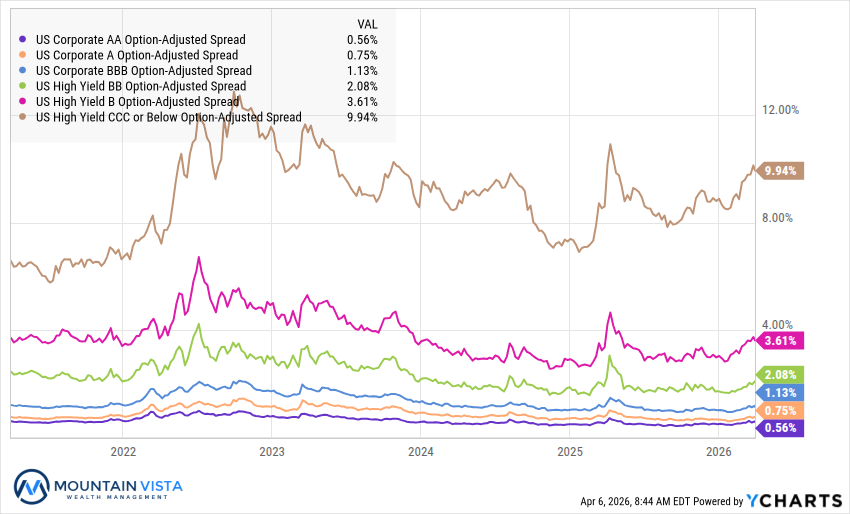
U.S. Corporate Credit Spreads
Commodity and Bitcoin Total Return
| ETF | Description | Q1 2026 Total Return | Since February 25, 2026 Total Return | 2025 Total Return |
| PDBC | Diversified Commodity | 30.7% | 17.7% | 6.0% |
| GLD | Gold | 8.6% | (9.1%) | 63.7% |
| DBB | Base Metals | 2.4% | (3.5%) | 25.0% |
| USO | Oil | 84.0% | 59.6% | (8.5%) |
| FBTC | Bitcoin | (22.6%) | (2.1%) | (6.6%) |
| ETHA | Ethereum | (29.4%) | 1.0% | (11.3%) |
Disclaimer
The views and opinions expressed are for informational and educational purposes only as of the date of writing and may change at any time based on market or other conditions and may not come to pass. This material is not intended to be relied upon as investment advice or recommendations, does not constitute a solicitation to buy or sell securities and should not be considered specific legal, investment or tax advice. The information provided does not take into account the specific objectives, financial situation, or particular needs of any specific person. All investments carry a certain degree of risk and there is no assurance that an investment will provide positive performance over any period of time. Equity investments are subject to market risk or the risk that stocks will decline in response to such factors as adverse company news or industry developments or a general economic decline. Debt or fixed income securities are subject to market risk, credit risk, interest rate risk, call risk, tax risk, political and economic risk, and income risk. As interest rates rise, bond prices fall. Non-investment-grade bonds involve heightened credit risk, liquidity risk, and potential for default. Foreign investing involves additional risks, including currency fluctuation, political and economic instability, lack of liquidity and differing legal and accounting standards. These risks are magnified in emerging markets. Past performance is no guarantee of future results.