
INTRODUCTION
“The more things change, the more they stay the same”
-Jean-Baptiste Alphonse Karr
While the last 15 months have been anything but ordinary, someone simply observing financial market performance over the last three months could be excused for assuming it was business as usual. Many of the trends that were in place before the pandemic, namely lower rates, growth/large cap outperformance and daily all-time highs in the equity indices, reestablished themselves.
The market is forward thinking and anticipates future economic shifts, which often results in behavior that is contrary to the prevailing narrative. Based upon its recent performance, the market seems to be telling us that the trends we are currently experiencing, such as high inflation, record economic growth and tight supply chains, is temporary and the post reopening economy will look a lot like the economy of the last 10-plus years.
While this may just end up being a speed bump, and the recovery trade comes back in full force in the second half of the year, it should serve as a reminder to us as investors that we must keep our eyes focused on the horizon and not get enamored by what has already happened.
We deeply appreciate your confidence and will continue to work tirelessly to improve your financial future. Stay safe and stay invested!
Sincerely,

Jonathan R. Heagle, CFP®, CFA
President and Chief Investment Officer
OVERALL MARKET COMMENTARY
The beginning of the 2nd quarter looked a lot like the 1st quarter. The focus on was on economically sensitive sectors, such as energy, materials, industrials and financials. Technology and high growth stocks were weak and the market was focused on higher inflation and interest rates.
Toward the end of May, cracks in the reflation trade began to surface. First, long term interest rates began to fall after failing to push through their recent highs. Next, high flying commodities, such as lumber and copper fell precipitously. Finally, the cyclical sectors were amongst the worst performers in the month of June, after the Federal Reserve moved up their timeline for rate hikes and upgraded their outlook for inflation.
Despite the volatility within the various sectors, the overall stock market had another strong quarter of gains with minimal volatility. SPY (S&P 500 ETF) and QQQ (Nasdaq 100 ETF) registered total returns of 8.4% and 11.2%, respectively. The largest drop experienced by the S&P 500 was a modest (-4%) in mid-May.
Over the last two quarters, we have spoken a lot about the “reopening trade” and the strength of value stocks. Many have been questioning if we are in the midst of a new era for value. We maintain that the outperformance of value and cyclical stocks, was likely to be episodic, hence the reason it is called a “trade”. Once we get through the initial bump in economic growth and inflationary pressures, we believe that our economy and markets will revert back to pre-pandemic trends.
Commodity Collapse
The pandemic caused disruptions in the supply chain of many goods and industries. Shortages of semiconductors hit autos. High lumber prices have slowed new construction projects. The decrease in supply in the face of a reopening economy caused spikes in the price of many commodities. Inflation hawks used these price increases to support their views that inflation was out of control and that the Federal Reserve was trashing the value of the dollar.
Meanwhile the yield on the 10-year treasury has fallen from a high of 1.75% to 1.44%, signaling a much more sanguine view of medium to long term inflation. The bond market has apparently adopted the Fed’s view that inflation is transitory. Recent moves in the commodities complex would support that view (see graphs below). While it will take some time for the inflation story to play out, we expect inflation to moderate over the medium term.
Figure 1: Copper Futures (Jun 2021 contract as of 6/18/21)
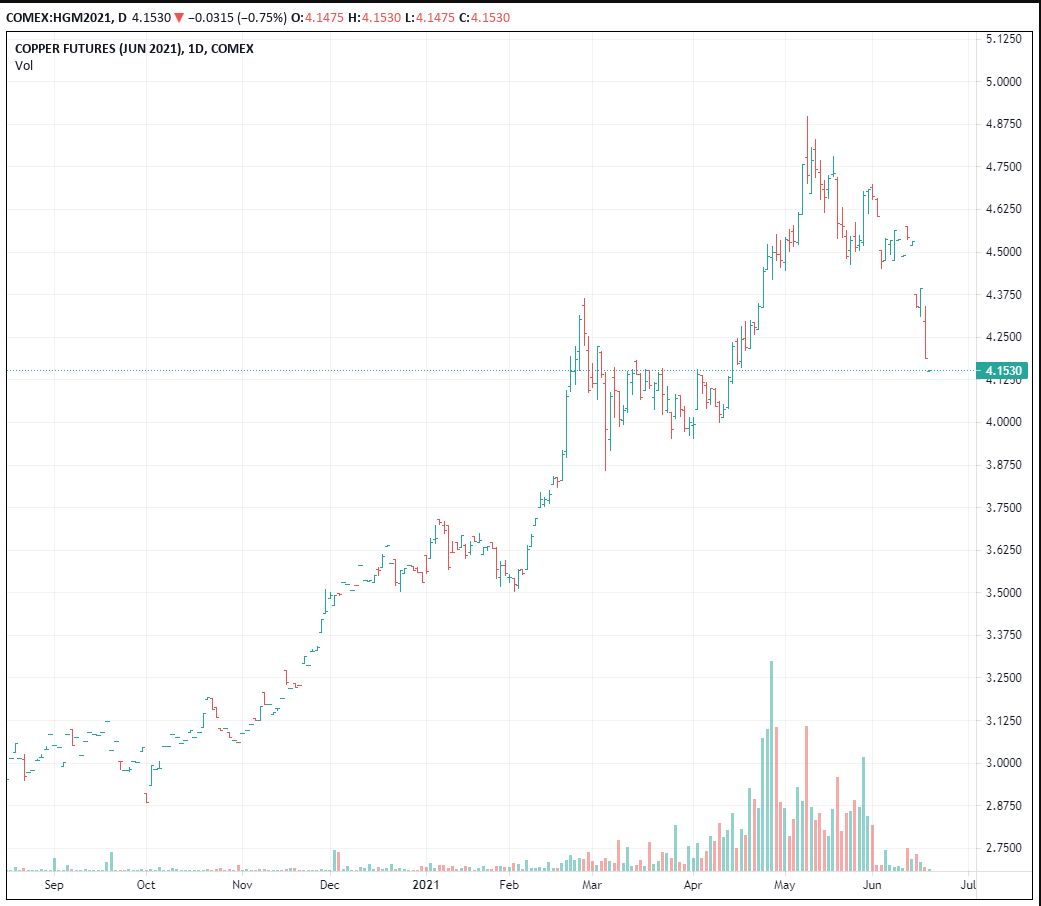
Figure 2: Lumber Futures (Jun 2021 contract as of 6/18/21)
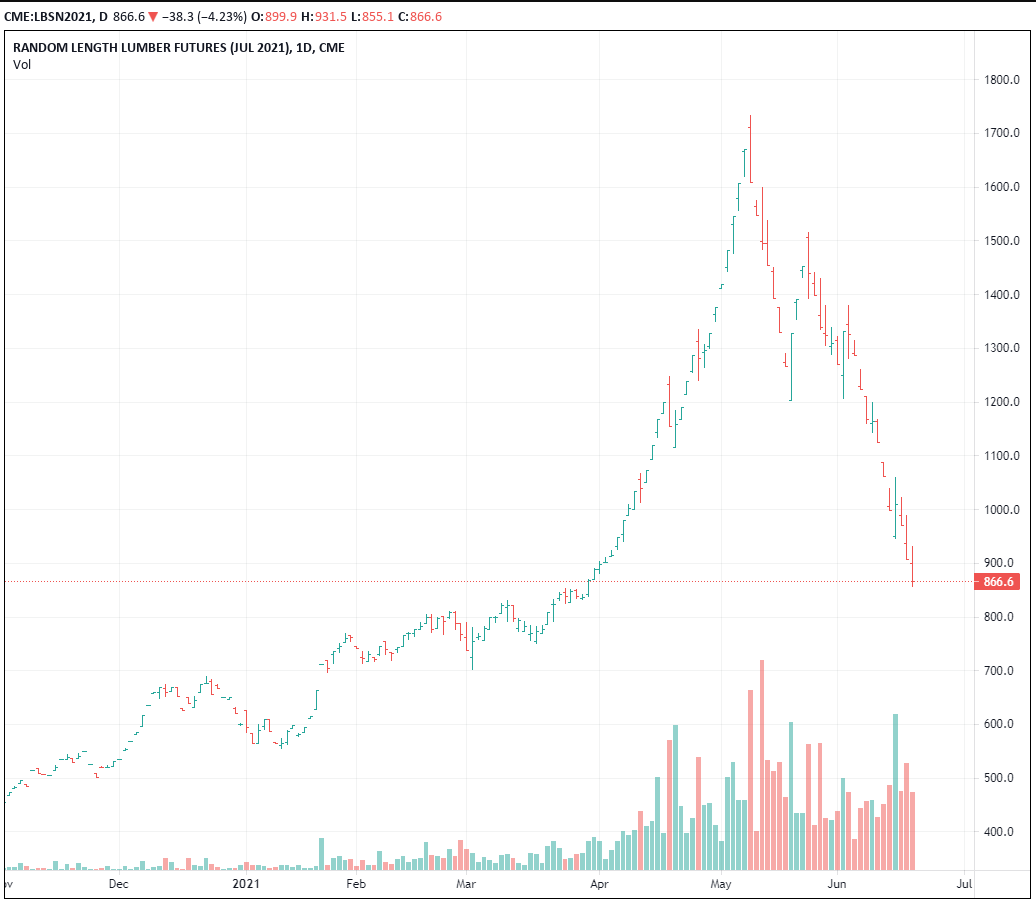
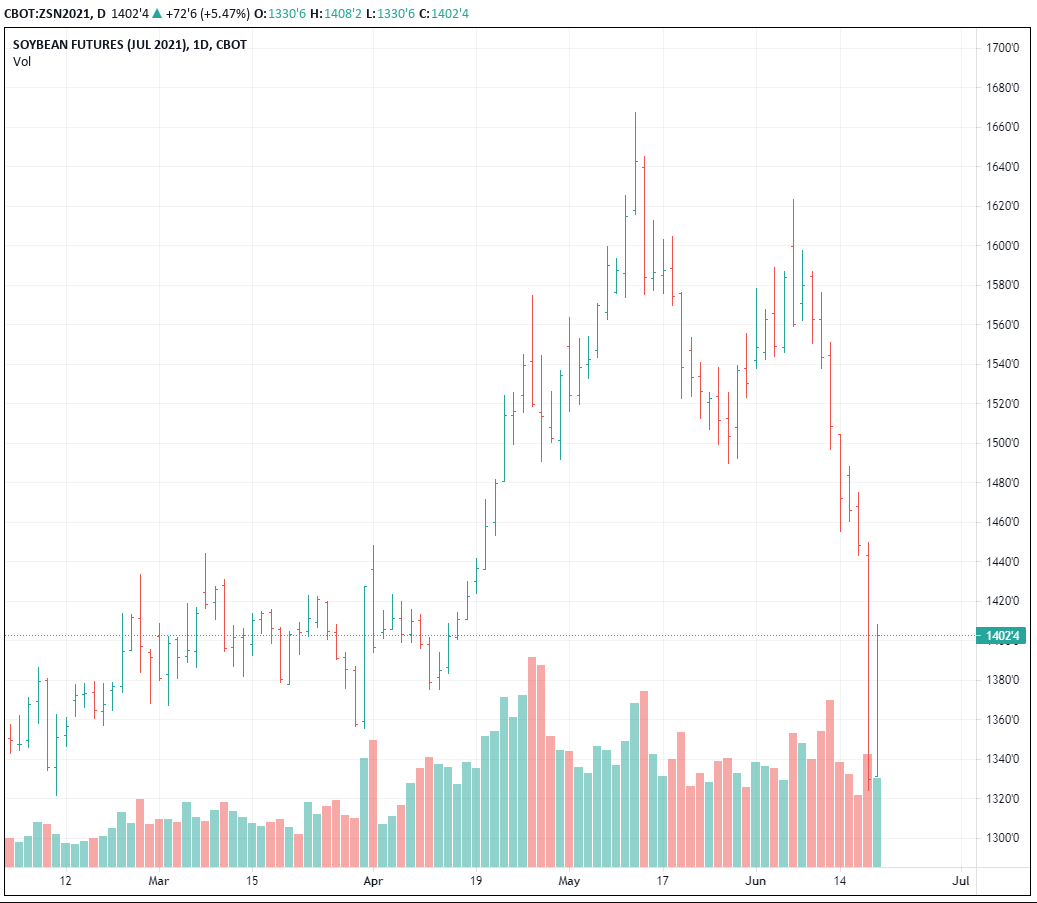
Figure 3: Soybean Futures (Jun 2021 contract as of 6/18/21)
EQUITY MARKET
Figure 4: Equity Index ETF Returns
| ETF | Description | Q2 2021 Total Return | 2021 YTD Total Return |
| SPY | S&P 500 | 8.4% | 15.2% |
| QQQ | Nasdaq 100 | 11.2% | 13.2% |
| IWM | Russell 2000 | 4.0% | 17.4% |
| IVW | S&P 500 Growth | 11.8% | 14.3% |
| IVE | S&P 500 Value | 4.9% | 16.3% |
| VXUS | International Ex-US | 5.6% | 10.3% |
| IEMG | Emerging Markets | 4.8% | 8.7% |
In the 2nd quarter, we saw a reversal of the 1st quarter trends. Growth outperformed value, large outperformed small and domestic outperformed international. This looks a lot like the regime of the last 10 years, pre-pandemic. SPY (S&P 500 ETF) and QQQ (Nasdaq 100 ETF) both saw strong gains of 8.4% and 11.2%, respectively.
While small capitalization stocks exploded higher in the 1st quarter, they underperformed in the 2nd quarter. IWM (Russell 2000 ETF) managed a 4.0% return in Q2 2021, and 17.4% year-to-date. Small cap stocks performance will be very correlated with the strength of growth in the post-pandemic economy.
After outperforming growth over the prior two quarters, value stocks underperformed in the 2nd quarter. IVE (S&P 500 Value ETF) and IVW (S&P 500 Growth ETF) generated quarterly returns of 4.9% and 11.8%, respectively. While the value resurgence may not be dead yet, we believe that growth will outperform on a medium to long term basis and have adjusted portfolios to reflect this view.
International equities and emerging markets equities underperformed U.S. equities. In the 2nd quarter, VXUS (International ETF) and IEMG (Emerging Market ETF) returned 5.6% and 4.8%, respectively. Many foreign countries continue to struggle to control COVID-19, which may explain the recent underperformance.
We maintain a neutral weight towards equities, given the strong economic backdrop and historically low bond yields. We are optimistic on equity performance in the 2nd half of the year and will look to buy any near-term dip.
Figure 5: Equity Sector Returns
| ETF | Description | Q2 2021 Total Return | 2021 YTD Total Return |
| XLRE | Real Estate | 13.0% | 23.3% |
| XLK | Technology | 11.4% | 14.0% |
| XLE | Energy | 10.9% | 45.1% |
| XLC | Communications | 10.6% | 20.4% |
| XLV | Healthcare | 8.3% | 11.8% |
| XLF | Financials | 8.2% | 25.5% |
| XLY | Consumer Disc | 6.4% | 11.4% |
| XLB | Materials | 4.9% | 14.7% |
| XLI | Industrials | 4.3% | 16.4% |
| IYZ | Telecom | 3.4% | 11.5% |
| XLP | Consumer Staples | 3.1% | 5.0% |
| XLU | Utilities | (0.5%) | 2.4% |
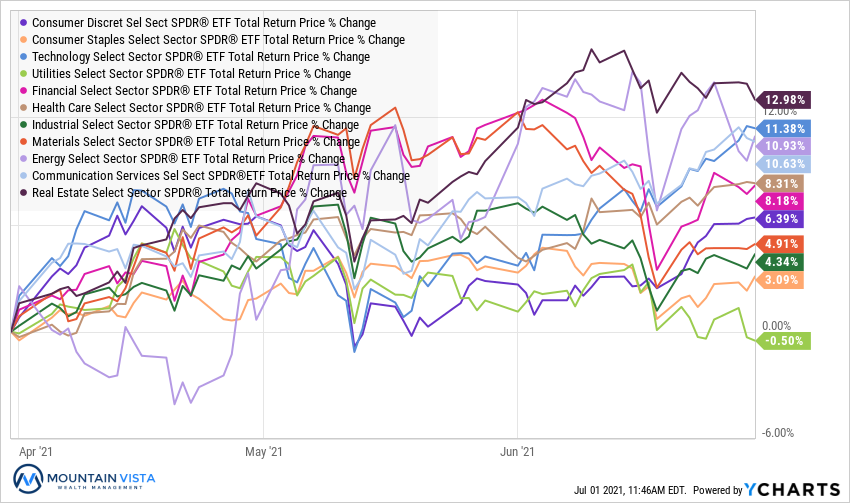
In the 2nd quarter, we saw a material change in leadership take place. With the exception of XLE (Energy Sector ETF), sectors associated with the “reopening trade” underperformed technology related sectors, such as XLK (Technology Sector ETF) and XLC (Communications Sector ETF). This rotation started in May, but accelerated in June, and was fueled by a drop in long-term interest rates and a shift in the market’s focus to the economy post reopening.
XLRE (Real Estate Sector ETF) soared 13.0% in the 2nd quarter, benefiting from lower interest rates and improving fundamentals. XLK, XLE and XLC rounded out the top 4 with quarterly gains of 11.4%, 10.9% and 10.6%, respectively. XLP (Consumer Discretionary Sector ETF) and XLU (Utilities Sector ETF) were the worst performing sectors, with quarterly returns of 3.1% and (-0.5%), respectively.
During the quarter, we removed our overweight in XLI and XLF and initiated overweight positions in XLRE, XLK and XLC. This shift in positioning is in anticipation of a shift towards slowing economic growth as stimulus and pent-up demand fade.
Figure 6: Equity Sector Year-to-Date Total Return
FIXED INCOME MARKET
Figure 7: Fixed Income Returns
| ETF | Description | Q2 2021 Total Return | 2021 YTD Total Return |
| AGG | Aggregate Bond | 1.8% | (1.7%) |
| BND | Total Bond Market | 1.9% | (1.8%) |
| LQD | IG Corporate | 3.9% | (1.8%) |
| JNK | HY Corporate | 2.1% | 2.8% |
| EMB | $ EM Bonds | 4.3% | (1.4%) |
| SHY | 1-3 Yr Treasuries | (0.1%) | (0.1%) |
| IEF | 7-10 Yr Treasuries | 2.5% | (3.4%) |
| TLT | 20+ Yr Treasuries | 7.0% | (7.9%) |
| TIP | TIPs | 3.2% | 1.5% |
One of the biggest surprises of the 2nd quarter, has been the strength of long-term treasuries. The yield on the 10-year U.S. Treasury started the quarter at 1.74% and fell to 1.44%. This move is counterintuitive when you consider that the U.S. economy experienced its fastest GDP growth since the early 1980s and the year-over-year change in the Consumer Price Index was 4.99% at the end of May.
TLT (U.S. Treasury 20+ year ETF) saw the largest gain with a 1st quarter return of 7.0%. Despite the strong quarterly performance, TLT is still has a (-7.9%) year-to-date return. Credit also generated positive returns with LQD (IG Corporate Bond ETF) and JNK (High Yield Corporate Bond ETF) returning 3.9% and 2.1%, respectively.
EMB (Emerging Market Dollar Bond ETF) returned 4.3% in the quarter. Emerging Market bond strength persisted, despite the spike in the U.S. dollar at the end of June.
We remain underweight fixed income, in favor of cash. We are waiting for a 2% yield on the 10-year U.S. Treasury to return to a neutral weight. We are monitoring the economy closely and will adjust our view and entry price, if necessary.
Figure 8: U.S. Treasury Yields
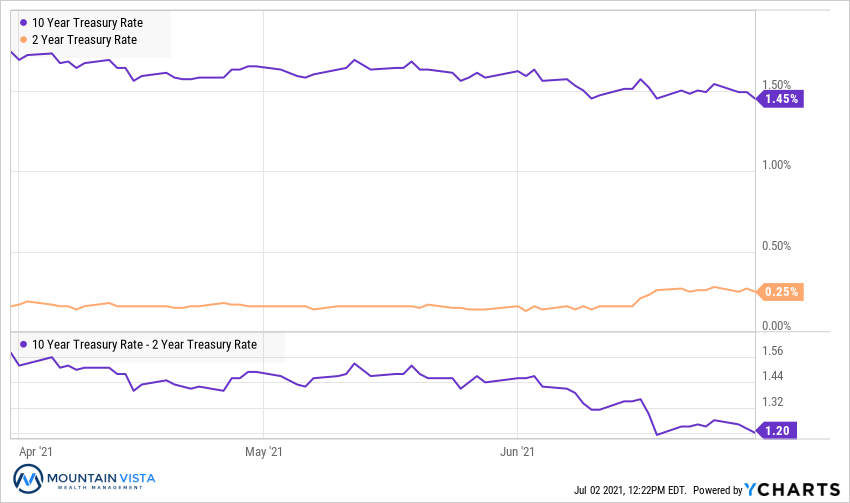
The treasury curve flattened in the 2nd quarter. 10-year U.S. Treasury yields decreased by 29 bps to 1.45%, while the 2-year U.S. Treasury yield increased by 9 bps to 0.25%. This resulted in a 38 bps decrease in the spread between 2’s and 10’s. In June, the flattening of the curve began to weigh on Financials, who profit from a higher spread through their lending operations.
Like many, we were surprised by this move lower in long-term yields. While we would not be surprised to see higher yields in the coming months, they are now being driven by the market’s view of the economy post-reopening.
Figure 9: U.S. Corporate Credit Spreads
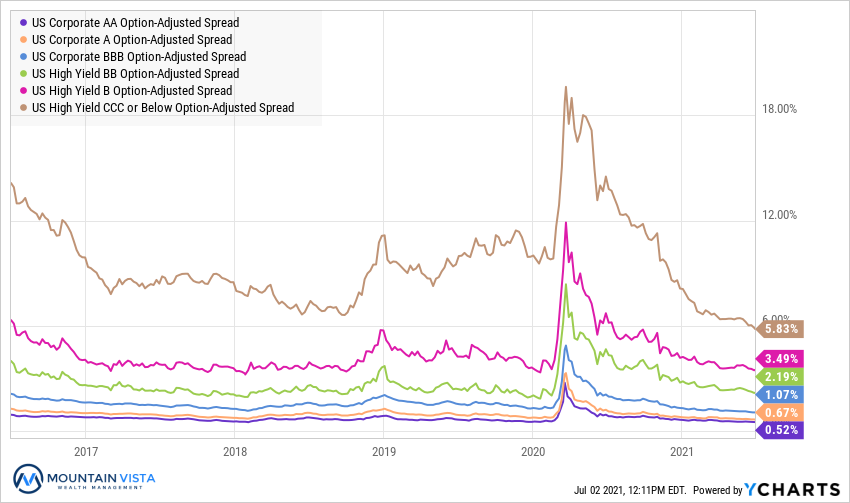
Corporate credit spreads continued to tighten over the course of the 2nd quarter, benefiting from the strong economy and inflationary backdrop. CCC-spreads are now 80 bps below the lowest levels seen in 2018 and are at levels not seen since prior to the financial crisis.
CCC-rated bond spreads tightened by 75 bps over the 2nd quarter and are back to levels last seen in 2007. Rarely have we seen deep credit spreads this low and the equity market is likely to remain well supported if they remain firm. AA-rated bonds tightened by 7 bps.
The credit markets continue to flash green, which implies that drops in the equity markets are likely to be buying opportunities.
CONCLUSION
As the Federal Reserve transitions policy from extreme accommodation, expect the voices of the doomsday crowd to grow louder. Rest assured that the Fed is very aware of the repercussions of tightening too quickly and does not want to disrupt the markets and/or economy for no good reason.
That being said, it is likely that the stock market will experience a correction at some point, if for no other reason than that is what the market does. According to Yardini Research, since 1950, the market has experienced a correction, defined as a drop of at least 10%, every 1.87 years.
Do not panic when a correction happens. Accept that a correction WILL happen and prepare accordingly. Build a cash reserve, diversify into fixed income and commodities and be prepared to buy the dip. Seeing the value of your portfolio drop during a correction is never fun, but if you are prepared, a drop in prices is actually an opportunity!
Thank you to our clients for your continued support of Mountain Vista. I look forward to helping you navigate the second half of 2021.
Sincerely,
Jonathan R. Heagle, CFP®, CFA
President and Chief Investment Officer
Disclaimer
The views and opinions expressed are for informational and educational purposes only as of the date of writing and may change at any time based on market or other conditions and may not come to pass. This material is not intended to be relied upon as investment advice or recommendations, does not constitute a solicitation to buy or sell securities and should not be considered specific legal, investment or tax advice. The information provided does not take into account the specific objectives, financial situation, or particular needs of any specific person. All investments carry a certain degree of risk and there is no assurance that an investment will provide positive performance over any period of time. Equity investments are subject to market risk or the risk that stocks will decline in response to such factors as adverse company news or industry developments or a general economic decline. Debt or fixed income securities are subject to market risk, credit risk, interest rate risk, call risk, tax risk, political and economic risk, and income risk. As interest rates rise, bond prices fall. Non-investment-grade bonds involve heightened credit risk, liquidity risk, and potential for default. Foreign investing involves additional risks, including currency fluctuation, political and economic instability, lack of liquidity and differing legal and accounting standards. These risks are magnified in emerging markets. Past performance is no guarantee of future results.