
INTRODUCTION
“Bull markets are born in pessimism, grow on skepticism, mature on optimism and die on euphoria. The time of maximum pessimism is the best time to buy, and the time of maximum optimism is the best time to sell.” -John Templeton
The contrast between market sentiment in 2021 and 2022 could not be more extreme. According to the AAII Investor Sentiment Survey, the spread between the percentage of “bullish” and “bearish” investors was +20 last year and was -38.9 this June. Extremes in market sentiment are typically viewed as a contrarian indicator. High readings signal a fully invested buyer base and low readings suggest cash on the sidelines that will turn into future demand.
A year ago, investors were greedily gobbling up “blank check” SPAC and IPO issuance and bitcoin touched $62,000. Movements in the price of “meme stocks” were consistently the top story on CNBC, sucking in retail dollars. Today, bitcoin is dancing around $20,000, the high-growth ETF ARKK is down (-74%) from its 2021 high and the Nasdaq 100 is down (-29%) year-to-date.
In hindsight, the speculative excesses of 2021 are apparent to everyone. In the moment, it is hard for many professionals, let alone the average person, to avoid buying in at the peak or selling at market lows. Unfortunately, this is why most people struggle to achieve the 8-10% long term returns of the equity market. While there is no guarantee that the market will not head lower in the near-term, there are, admittedly, a lot of headwinds, investors with a longer-term horizon will likely be rewarded for buying at these levels.
Our tactical asset allocation strategy allows us to react to irrational market pricing during extremes, while staying true to long-term allocations. Our pivot to defensive sectors, downgrading of equities and allocation to commodities have provided some support during this difficult market. When sentiment turns, and it will, we will adjust our strategy to capture the upside once again.
It is our mission to preserve and grow our clients’ hard-earned savings. We take this responsibility very seriously. 2022 has been a challenging year thus far, but we will come out stronger on the other side. We appreciate the trust you have placed in our team and our process.
Sincerely,
Jonathan R. Heagle, CFP®, CFA
President and Chief Investment Officer
OVERALL MARKET COMMENTARY
There is no sugarcoating it, the 2nd quarter was brutal. The S&P 500 shed (-16.1%) and the Nasdaq 100 crashed (-22.5%). Similar to the 1st quarter, bonds did not provide a safe haven, with the Bloomberg Aggregate U.S. Bond Index falling (-4.6%). The coordinated movement, or correlation, of stocks and bonds has made 2022 especially painful. Since the 1980s, bonds have provided stability during corrections in the equity market, reducing the losses to a blended portfolio. The resurgence of inflation has temporarily altered this relationship.
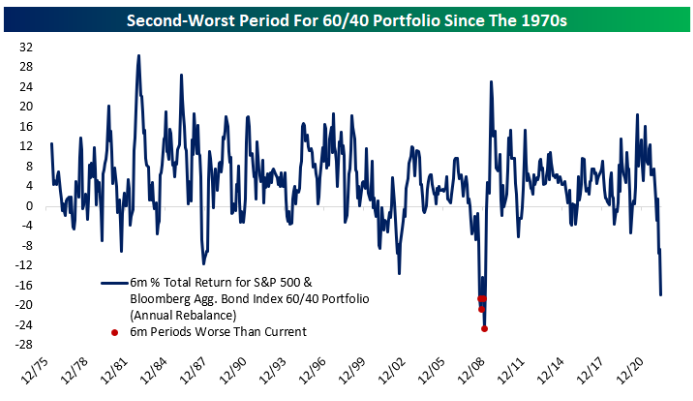
60/40 Portfolio Continues to Struggle
The “60/40” portfolio of stocks and bonds is enduring one of its worst drawdowns in history. While the S&P 500 experienced declines of approximatel 20% in 2011 and 2018, the 6-month total returns of the 60/40 portfolio were down a fraction of that amount. Even during the Great Recession, bonds helped cushion the equity losses, which were significantly greater than what we are experiencing now.
Figure 1: 6-month Total Return of 60% S&P 500 / 40% Bloomberg Agg Index
Inflation, Inflation, Inflation…and the Fed
While there are many causes of the market’s struggles this year, it is really all about inflation and the Federal Reserve’s response to it. Since the Great Recession, inflation has been non-existent, which allowed the Federal Reserve to ease policy every time the economy slowed, or the financial markets got too bumpy. Investors called this response the “Fed put”.
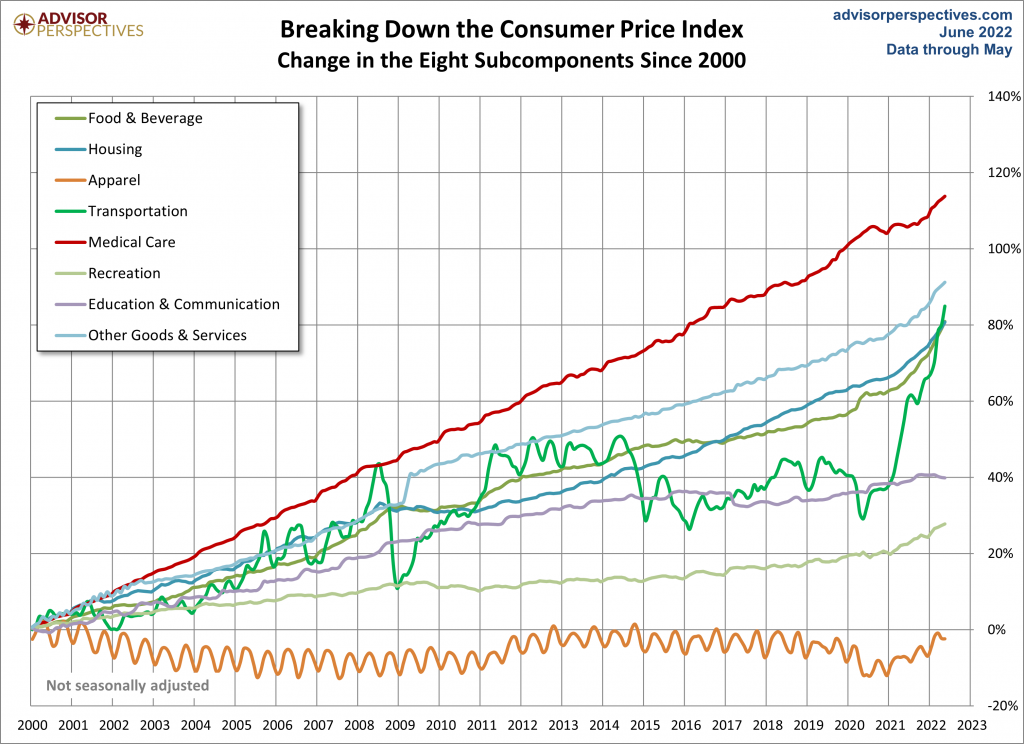
The broadening out of inflation from “transitory” to widespread and persistent, caused the Fed put to expire. The Federal Reserve’s number one goal today is to anchor long-term inflation expectations and gradually bring realized inflation down to their 2% target. Until clear progress towards this goal is achieved, they will not be able to ease in response to a weakening economy or market declines.
Figure 2: Consumer Price Index Subcomponents Since 2000
In a perverse way, the Fed may want lower asset prices. The idea is that investors feel less wealthy when their investments fall in value, causing them to reduce discretionary spending. The reduction in spending lowers aggregate demand in the economy, putting downward pressure on inflation. Their hope is that they can lower demand enough to bring down inflation without pushing the economy into recession.
Many investors were hoping that the Consumer Price Index (CPI) would show signs of topping out in May, but the reading came in at a hotter-than-expected 8.6%. Even more concerning, the month-over-month increase accelerated to 1%. Components that were showing progress in April, such as Transportation and Energy, reaccelerated in May.
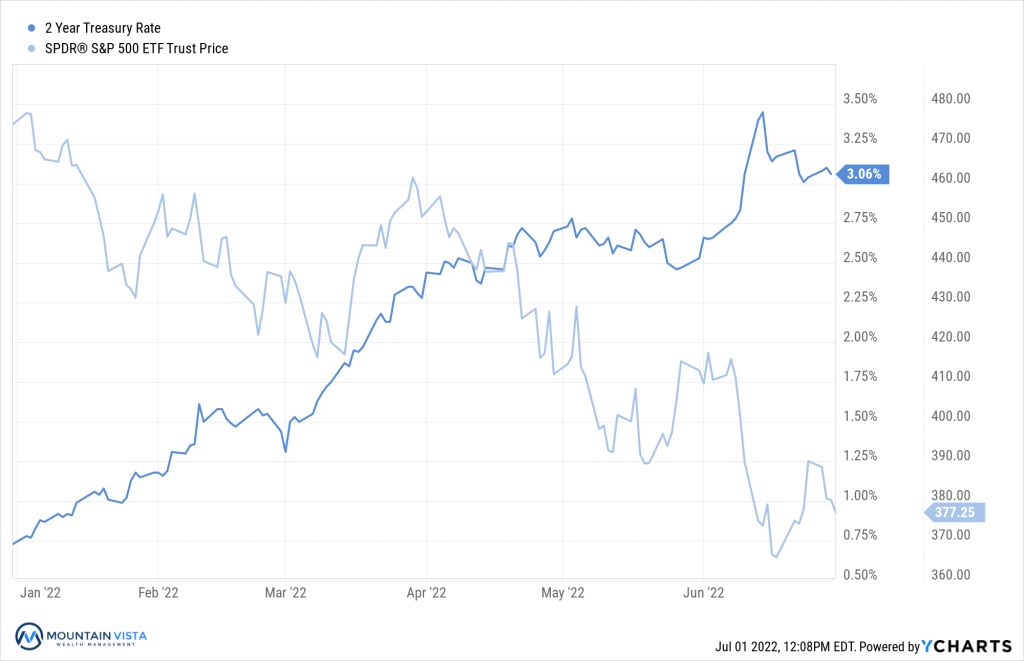
This caused the Federal Reserve to increase the Fed Funds rate by 75 bps at the June meeting, after telegraphing 50 bps just a month earlier. Stocks plummeted and bond yields shot higher. Yields have since come down as Chairman Powell has reiterated their commitment to bring down inflation, suggesting this may be a “whatever it takes” moment to break inflation. The unfortunate fallout from this newly declared war on inflation may be a recession and a weaker labor market.
Figure 3: Year-to-Date 2-Year U.S. Treasury Bond Yield and SPY (S&P 500 ETF)
The large increase in interest rates has also translated into higher mortgage rates for home buyers. While the 10-year U.S. treasury yield has increased meaningfully, 30-year fixed mortgage rates have increased even more. As you can see below, the spread between the 10-year treasury yield and the 30-year mortgage rate has increased from 160 bps in January 2022 to 272 bps.
Figure 4: 30-Year Fixed Mortgage Rate and 10-Year U.S. Treasury Bond Yield
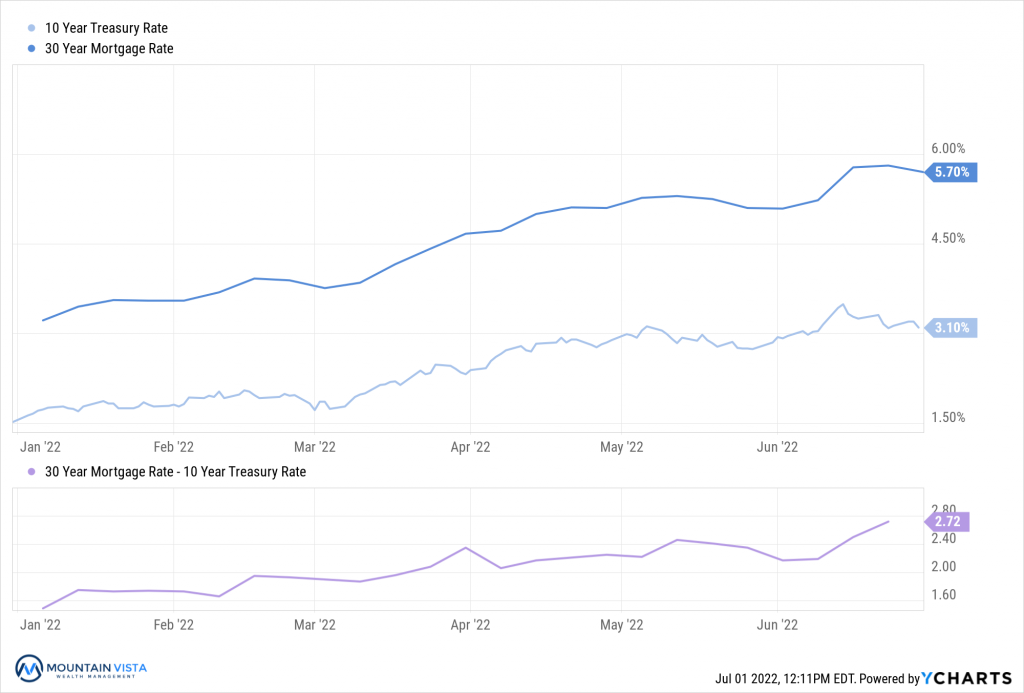
Figure 5: Median Monthly Payment of 30-Year Fixed Mortgage since 1996

Rapidly rising home prices, coupled with the surge in mortgage rates, have produced a very unaffordable housing market. According to Goldman Sachs, the median monthly payment of a 30-year fixed mortgage has almost doubled from the pandemic low. That being said, the housing market is on a firmer footing than in 2007/8 due to: 1) more conservative lending practices, 2) positive demographics and 3) historically low levels of inventory (for now).
EQUITY MARKET
Figure 6: Equity Index ETF Returns
| ETF | Description | Q2 2022 Total Return | Year-to-Date Total Return |
| SPY | S&P 500 | (16.1%) | (20.0%) |
| QQQ | Nasdaq 100 | (22.5%) | (29.3%) |
| IWM | Russell 2000 | (17.3%) | (23.5%) |
| IVW | S&P 500 Growth | (20.9%) | (27.6%) |
| IVE | S&P 500 Value | (11.4%) | (11.5%) |
| VXUS | International Ex-US | (12.6%) | (17.7%) |
| IEMG | Emerging Markets | (10.7%) | (17.1%) |
In the 2nd quarter of 2022, we saw a continuation of the bearish trend from Q1 2022. SPY (S&P 500 ETF) and QQQ (Nasdaq 100 ETF) returned (-16.1%) and (-22.5%), respectively, leaving them down (-20.0%) and (-29.3%) year-to-date, respectively. The S&P 500 officially entered a bear market in June and suffered a peak-to-trough loss of (-23.4%) as of June 17th.
Small capitalization stocks modestly underperformed large capitalization stocks. IWM (Russell 2000 ETF) returned (-17.3%) in the 2nd quarter and is down (-30.4%) from its November 2021 high, comparable to the losses experienced by the QQQ (Nasdaq 100 ETF).
Value stocks meaningfully outperformed Growth stocks for the 2nd quarter in a row. Inflation and increasing interest rates dominated investor attention, putting pressure on stocks with high valuation multiples and low or no current earnings. IVE (S&P 500 Value ETF) and IVW (S&P 500 Growth ETF) generated quarterly returns of (-11.4%) and (-20.9%), respectively.
International and Emerging Markets both outperformed the S&P 500 in the quarter, resulting in a modest 3% outperformance on a year-to-date basis. In the 2nd quarter, VXUS (International ETF) declined (-12.6%) and IEMG (Emerging Market ETF) fell (-10.7%).
We expect volatility to persist as the Federal Reserve removes accommodative monetary policy and end the quarter defensively positioned. That being said, we would not be surprised to see the Federal Reserve pivot to a less hawkish stance in the 2nd half of 2022 should inflation show credible signs of cooling. Until that time, we will remain defensively postured.
Figure 7: Equity Sector Returns
| ETF | Description | Q2 2022 Total Return | Year-to-Date Total Return |
| XLP | Consumer Staples | (4.2%) | (5.3%) |
| XLU | Utilities | (5.1%) | (0.6%) |
| XLE | Energy | (5.4%) | 31.5% |
| XLV | Healthcare | (6.0%) | (8.3%) |
| XLRE | Real Estate | (14.8%) | (20.0%) |
| XLI | Industrials | (14.8%) | (16.8%) |
| IYZ | Telecom | (15.4%) | (22.8%) |
| XLB | Materials | (15.9%) | (17.9%) |
| XLF | Financials | (17.5%) | (18.7%) |
| XLK | Technology | (19.8%) | (26.6%) |
| XLC | Communications | (20.9%) | (29.8%) |
| XLY | Consumer Disc | (25.5%) | (32.5%) |
XLP (Consumer Staples Sector ETF) was the top performing sector in the 2nd quarter with a loss of (-4.2%). XLU (Utilities Sector ETF) was the runner up, with a quarterly return of (-5.1%). At its peak, XLE (Energy Sector ETF) was up over 20% in the quarter, before dropping precipitously in late June, and finishing the quarter down (-5.4%). XLE remains the leader on a year-to-date basis by a wide margin.
Similar to the 1st quarter, XLY (Consumer Discretionary Sector ETF) and XLC (Communications Sector ETF) were the worst performing sectors with total returns of (-25.5%) and (-20.9%), respectively. XLY was impacted by concerns about consumers spending in light of high gas prices and the increasing likelihood of a recession.
We maintain our defensive posture with overweight positions in consumer staples, utilities and healthcare. These sectors should continue to outperform should the economy continue to slow and potentially enter a recession.
Figure 8: Equity Sector Quarterly Total Return

FIXED INCOME MARKET
Figure 9: Fixed Income Returns
| ETF | Description | Q2 2022 Total Return | Year-to-Date Total Return |
| AGG | Aggregate Bond | (4.6%) | (10.2%) |
| BND | Total Bond Market | (4.8%) | (10.4%) |
| LQD | IG Corporate | (8.4%) | (16.1%) |
| JNK | HY Corporate | (10.4%) | (14.8%) |
| EMB | $ EM Bonds | (11.7%) | (20.3%) |
| SHY | 1-3 Yr Treasuries | (0.5%) | (3.0%) |
| IEF | 7-10 Yr Treasuries | (4.5%) | (10.6%) |
| TLT | 20+ Yr Treasuries | (12.6%) | (21.9%) |
| TIP | TIPs | (6.2%) | (9.1%) |
Fixed income continued to struggle in the 2nd quarter, as inflation escalated, and the Federal Reserve was forced to combat the spiraling increase in prices. This hawkish pivot pushed U.S. Treasury yields higher, with the 2-Year and 10-Year both increasing by 78 bps.
SHY (1-3 Year US Treasury ETF) fared best in the increasing yield environment, losing only (-0.5%) in the 2nd quarter. Bonds lose value as yields increase and their sensitivity to yields goes up with the time to maturity. For this reason, it is logical that SHY outperformed other ETFs with longer term holdings.
EMB (Emerging Market Dollar Bond ETF) and TLT (20+ Year US Treasury ETF) fell (-11.7%) and
(-12.6%), respectively. EMB continues to be pressured by dollar strength and heightened risk aversion. TLT has the most rate sensitivity of the fixed income ETFs and was meaningfully impacted by increases in long-term yields.
With the dramatic move higher in interest rates, we think that fixed income is currently attractive based upon its income and ability to hedge against a regime shift towards lower inflation and economic growth. We expect this transition to occur over the next few months as tighter financial conditions work their way through the economy.
Figure 10: U.S. Treasury Yields
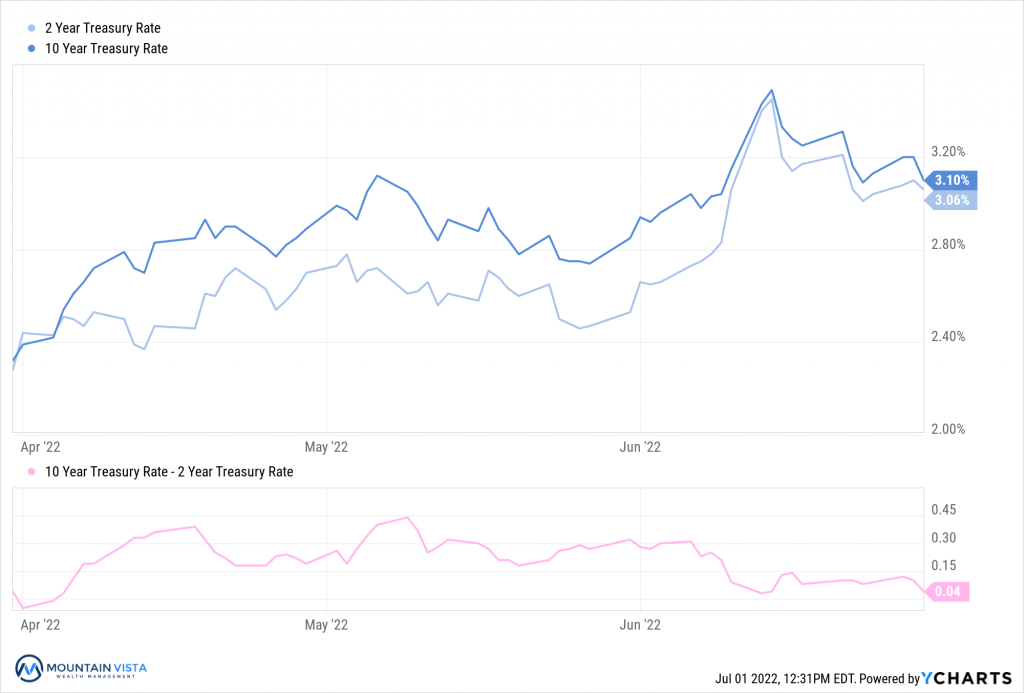
The U.S. Treasury curve steepened through April and May, reaching a peak of 44 bps. A hot May CPI print pushed up the 2-year yield, bringing the 2-year/10-year spread back to 4 bps, right where the quarter began. Over the three-month period, the 2-year and 10-year yield both increased by 78 bps.
Historically, an end to Quantitative Easing has placed downward pressure on the 2-year/10-year spread and long-term rates, as the market anticipated lower future inflation and growth. It is unclear if this trend will play out once again, but the recent peak in yields coincided with the June meeting, where the Fed surprised with a more aggressive tightening of 75 bps. Since they began Quantitative Tightening on June 1st, the 2-year/10-year spread has compressed from 32 bps to 4 bps.
Figure 11: U.S. Corporate Credit Spreads
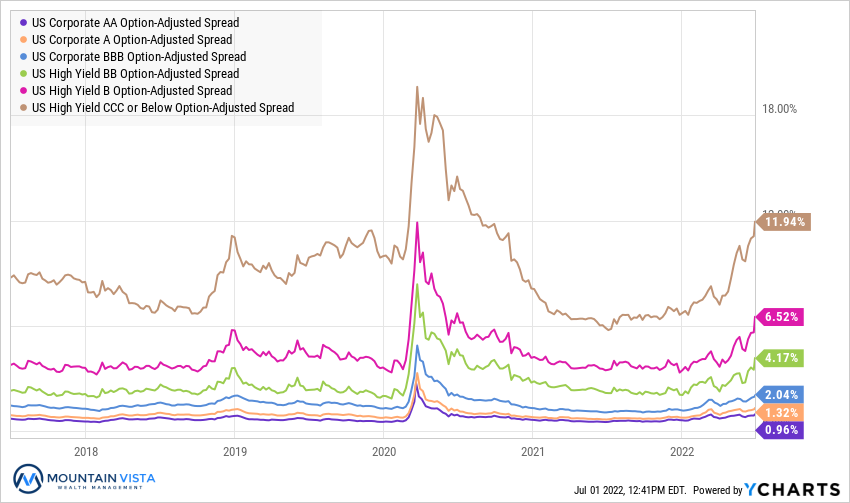
Corporate credit spreads moved materially higher down the credit curve, as the market has started to price in the risk of a recession. CCC-spreads are on par with their levels from 2019, but the rest of the curve is materially wider. This suggests that liquidity and systemic risk in the credit market is elevated.
CCC-rated and AA-rated bond spreads widened by 465 bps and 22 bps, respectively over the 2nd quarter, resulting in a much steeper credit curve.
Credit markets have weakened, but the sell-off has been orderly thus far. Should we see spreads on lower rated bonds gap wider, we will become more concerned about systemic risk and the potential for a material default cycle. Should the credit markets become too disorderly, the Federal Reserve may need to soften its rhetoric, or risk creating another credit crisis.
CONCLUSION
While it does not feel great to see your account value fall, it is important to remember 1) losses do not materialize unless you sell and 2) future expected returns are increasing.
While we expect the investing climate to remain volatile in the coming months, the market could turn rather quickly once the Federal Reserve’s actions result in progress on inflation. It is important to stay invested, because no one knows the moment when the collective conscience of the market will sniff this out or when the Federal Reserve will signal a change away from their current hawkish stance. Also, bottoms tend to be short-lived with large gains taking place over the course of a few days.
Thank you to our clients for your continued support of Mountain Vista. We are dedicated to helping you navigate this uncertain time and are constantly looking for ways to improve the risk-reward profile of your investment portfolio.
Sincerely,
Jonathan R. Heagle, CFP®, CFA
President and Chief Investment Officer
DISCLAIMER
The views and opinions expressed are for informational and educational purposes only as of the date of writing and may change at any time based on market or other conditions and may not come to pass. This material is not intended to be relied upon as investment advice or recommendations, does not constitute a solicitation to buy or sell securities and should not be considered specific legal, investment or tax advice. The information provided does not take into account the specific objectives, financial situation, or particular needs of any specific person. All investments carry a certain degree of risk and there is no assurance that an investment will provide positive performance over any period of time. Equity investments are subject to market risk or the risk that stocks will decline in response to such factors as adverse company news or industry developments or a general economic decline. Debt or fixed income securities are subject to market risk, credit risk, interest rate risk, call risk, tax risk, political and economic risk, and income risk. As interest rates rise, bond prices fall. Non-investment-grade bonds involve heightened credit risk, liquidity risk, and potential for default. Foreign investing involves additional risks, including currency fluctuation, political and economic instability, lack of liquidity and differing legal and accounting standards. These risks are magnified in emerging markets. Past performance is no guarantee of future results.