
INTRODUCTION
“It was the best of times, it was the worst of times…”
– Charles Dickens
As a financial advisor, I regularly encounter a wide spectrum of market opinions among my clients. On any given day, I might speak with one client who is convinced a stock market crash is imminent, and another who believes we are underinvested in the transformative AI technologies reshaping our economy. While either perspective may prove correct, it is equally possible that both assessments are misguided.
The current market presents a dichotomy. For investors heavily weighted towards large U.S. growth companies, it is a period of remarkable prosperity. Conversely, those focused on international, value, or small-cap stocks might be forgiven for overlooking the fact that we are in the midst of a robust bull market.
Seasoned investors understand that market behavior does not always align with our personal logic. There are times when market reactions seem to defy rational explanation, making it challenging to maintain conviction and potentially leading to underperformance.
Historical examples underscore the pitfalls of reactive investing. Consider Stanley Druckenmiller, the renowned hedge fund manager who invested $6 billion in tech stocks at the market’s peak in March 2000, after previously avoiding or shorting these same stocks. Similarly, how many investors liquidated their portfolios following Trump’s election or the COVID shutdown in March 2020, only to watch the stock market rise significantly in the subsequent months?
The reality is that investing is complex, and making sweeping “all-or-nothing” portfolio changes can lead to irreversible damage if poorly timed or unlucky. Over the years, we have identified several strategies to mitigate such risks: 1) extend your time horizon, 2) implement changes incrementally after careful consideration, 3) favor inaction versus hasty action and 4) approach “hot trends” with healthy skepticism.
Maintain diversification, stay invested, and preserve a calm and balanced perspective.
Sincerely,
Jonathan R. Heagle, CFP®, CFA
President and Chief Investment Officer
QUARTERLY ROUNDUP
Market Performance Overview
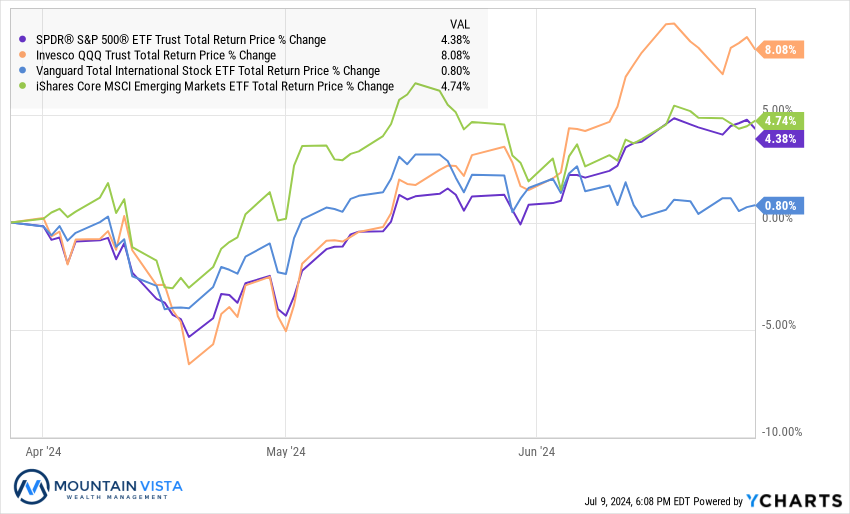
The S&P 500, our benchmark for the U.S. equity market, delivered a robust performance in the second quarter, returning 4.3%. Year-to-date, it has yielded an impressive 15.3% return, and an even more remarkable 34% when measured from the October 2023 low.
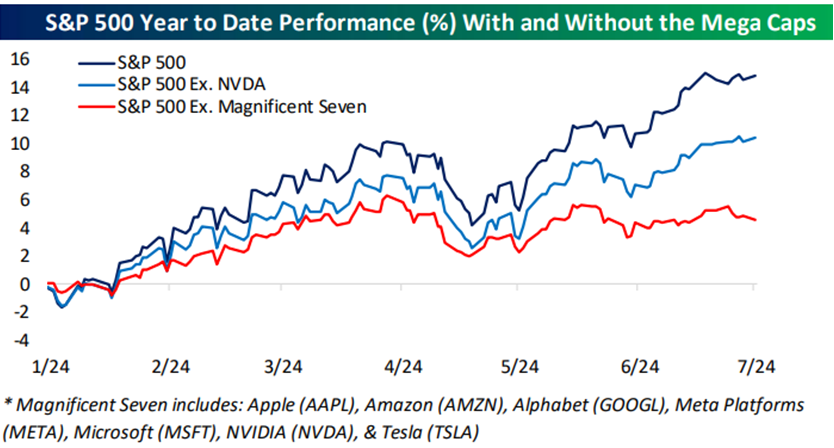
A closer look reveals that this performance was primarily driven by the largest companies, often referred to as the “Mega caps” or “Magnificent 7”. This concentration is evident in the Nasdaq 100’s quarterly return of 8.0%, nearly doubling the S&P 500’s gain. Furthermore, if we exclude the Magnificent 7 stocks from the S&P 500, its year-to-date performance drops significantly from 15% to 4%.
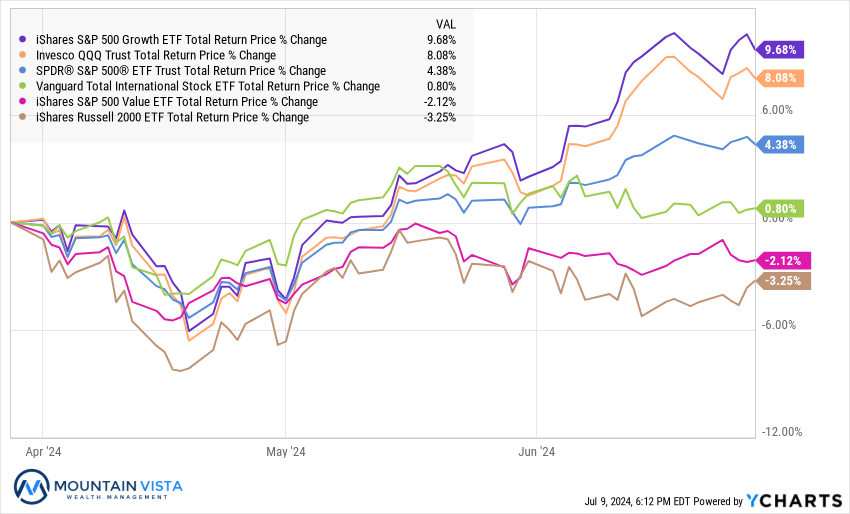
Growth stocks continued to outperform value stocks in the second quarter, with a nearly 12% gap. The S&P 500 Growth index (IVW) returned 9.7%, while the S&P 500 Value index (IVE) declined by 2.1%. International stocks struggled, with the Vanguard Total International Stock ETF (VXUS) barely breaking even. Small-cap stocks, represented by the Russell 2000 index (IWM), fell by 3.3%.
In essence, the Mega Cap stocks have been the primary contributors to this quarter’s gains, while the broader market has remained relatively flat. You can see the wide divergence in portfolio across stock market indices, based upon their underlying exposure to the Mega Cap stocks.
Market Breadth and Concentration
The concentrated performance has led to a divergence between the S&P 500 and the Cumulative Advance/Decline Line (CADL). The CADL, a technical indicator measuring market sentiment, has been declining while the S&P 500 rises. This suggests that the recent upward movement may not be sustainable without a recovery in market breadth.

However, it is important to note that this divergence is not unprecedented and is less extreme than what we witnessed in the late 1990s, despite the observed similarities between the current market environment and the tech bubble. Moreover, this gap could be resolved by a rally in the broader market rather than a decline in the outperforming Mega Cap stocks.
Federal Reserve and Inflation
The Federal Reserve’s revised Summary of Economic Projections (SEP) in June indicated expectations of only one rate cut in 2024 and higher inflation forecasts for the next two years compared to March projections. Despite this seemingly negative outlook, equities rallied 0.8% on the day of the announcement, likely due to better-than-expected Consumer Price Index (CPI) data released earlier that day.

The latest CPI data brought a welcome reprieve, with both headline and core inflation surprising to the downside. This positive development follows a period of less favorable readings, offering a glimmer of hope in the ongoing battle against inflation.
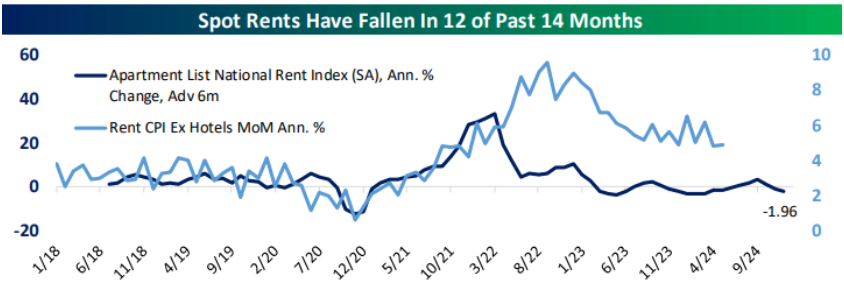
However, shelter inflation remains a persistent concern. Despite numerous market-based indicators suggesting minimal rent growth, the shelter component of CPI continues to show stubborn elevation. We are optimistic that the CPI shelter readings will eventually align more closely with real-time, observable market indicators.
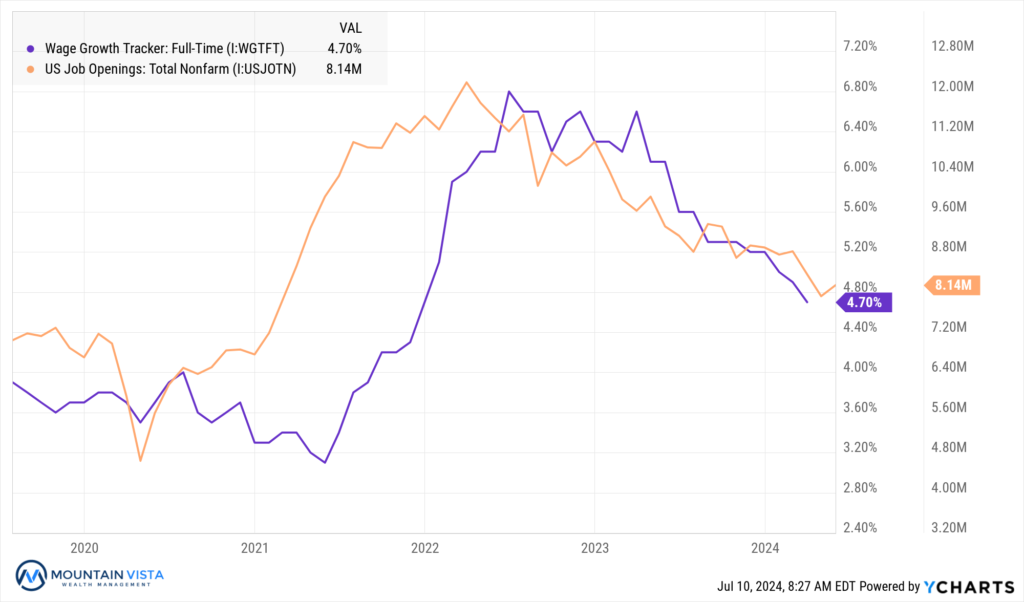
The robust labor market has been a key factor in the economy’s and inflation’s resilience in the face of aggressive interest rate hikes. Employed individuals with steady incomes continue to drive consumer spending, a crucial component of economic activity. Furthermore, in a job-rich environment, the balance of power in wage negotiations tends to shift towards employees, potentially leading to upward pressure on wages.
Job openings peaked in March 2022 and wage growth peaked shortly after in May 2022. Since then, both readings have steadily trended lower, but remain strong, relative to their pre-COVID levels. Pre-COVID, job openings ranged between 6mm and 8mm, while wage growth ranged between 3-4%.
Forward Expectations
Looking ahead, we expect the equity market to produce further gains through the end of the year. When the market is up strongly in the first half, the second half typically builds on those gains. That said, strong advances typically suffer temporary pullbacks and periods of consolidation. It would not be surprising to see a “sell-the-news” reaction to the first Federal Reserve rate cut, especially if economic data continues to weaken. That said, decreasing the Federal Funds rate to bring down real interest rates, coupled with moderate economic growth and lower inflation, should be supportive of risk assets, such as equities.
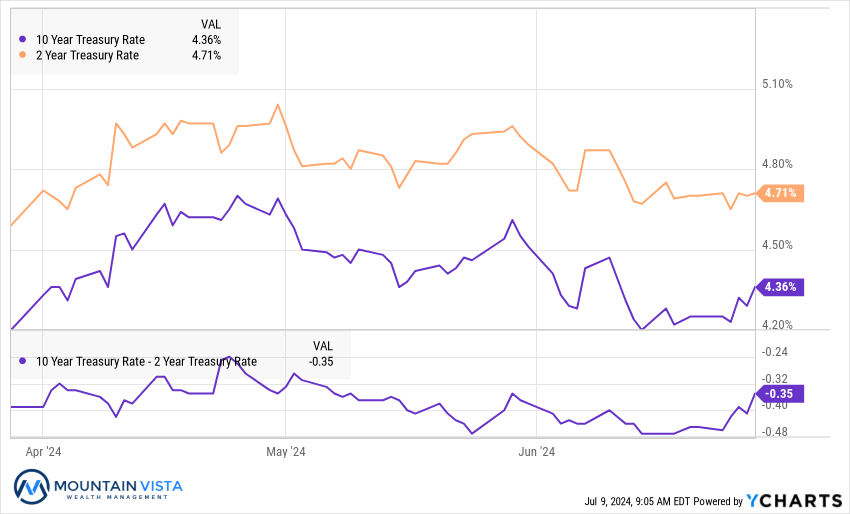
In the fixed income market, we do not expect 10-year U.S. Treasury yields to revisit their October 2023 highs. The yield curve will likely steepen as the Federal Reserve begins to cut rates, primarily due to falling short-term rates rather than rising long-term rates. However, we do expect a positive term premium to return, causing long term bond yields to exceed short-term rates.
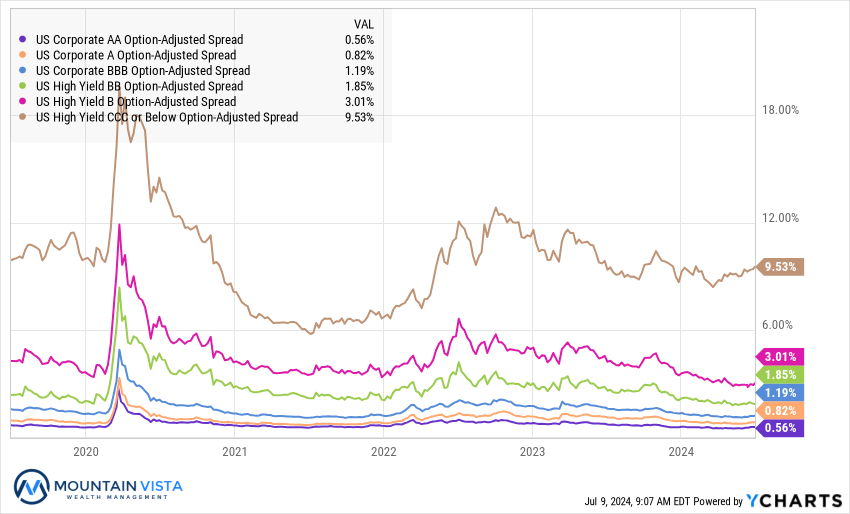
As inflation declines and economic growth moderates, credit risk warrants closer attention. The normalizing economic environment could potentially lead to increased default risk in the event of an economic shock. This should push credit spreads wider from their current tight levels.
We appreciate your time in reviewing this commentary and welcome any questions or discussions on these topics.
APPENDIX
Equity Index ETF Total Return
| ETF | Description | Q2 2024 Total Return | Since October 27, 2023 | 2024 Total Return |
| SPY | S&P 500 | 4.4% | 33.9% | 15.2% |
| QQQ | Nasdaq 100 | 8.1% | 39.5% | 17.3% |
| IWM | Russell 2000 | (3.3%) | 26.2% | 1.6% |
| IVW | S&P 500 Growth | 9.7% | 41.3% | 23.4% |
| IVE | S&P 500 Value | (2.1%) | 25.0% | 5.6% |
| VXUS | International Ex-US | 0.8% | 21.3% | 5.3% |
| IEMG | Emerging Markets | 4.7% | 20.5% | 6.9% |
U.S. Equity Sector Total Return
| ETF | Description | Q2 2024 Total Return | Since October 27, 2023 | 2024 Total Return |
| XLK | Technology | 8.8% | 41.2% | 17.9% |
| XLC | Communications | 5.2% | 36.8% | 18.5% |
| XLU | Utilities | 4.6% | 19.0% | 9.4% |
| XLP | Consumer Staples | 1.0% | 17.6% | 7.9% |
| IYZ | Telecom | (0.5%) | 11.2% | (3.3%) |
| XLY | Consumer Disc | (0.6%) | 22.7% | 2.4% |
| XLV | Healthcare | (1.0%) | 19.8% | 7.7% |
| XLRE | Real Estate | (1.8%) | 22.0% | (2.5%) |
| XLF | Financials | (2.0%) | 32.4% | 10.2% |
| XLE | Energy | (2.7%) | 10.5% | 10.5% |
| XLI | Industrials | (2.9%) | 27.9% | 7.6% |
| XLB | Materials | (4.5%) | 19.6% | 4.1% |
U.S. Equity Sector Total Return

Global Equity ETF Total Return
Fixed Income ETF Total Return
| ETF | Description | Q2 2024 Total Return | Since October 27, 2023 | 2024 Total Return |
| AGG | Aggregate Bond | 0.0% | 7.4% | (0.7%) |
| BND | Total Bond Market | 0.1% | 7.3% | (0.6%) |
| LQD | IG Corporate | (0.5%) | 10.8% | (1.4%) |
| JNK | HY Corporate | 0.7% | 11.3% | 2.3% |
| EMB | $ EM Bonds | (0.1%) | 12.9% | 1.4% |
| SHY | 1-3 Yr Treasuries | 0.8% | 3.2% | 1.1% |
| IEF | 7-10 Yr Treasuries | (0.2%) | 6.3% | (1.5%) |
| TLT | 20+ Yr Treasuries | (2.0%) | 11.7% | (5.6%) |
| TIP | TIPs | 0.8% | 5.6% | 0.7% |
U.S. Treasury Yields and 2/10 Spread
U.S. Corporate Credit Spreads
Commodity and Bitcoin Total Return
| ETF | Description | Q2 2024 Total Return | Since October 27, 2023 | 2024 Total Return |
| PDBC | Diversified Commodity | 1.3% | (2.3%) | 5.6% |
| GLD | Gold | 4.5% | 15.5% | 12.5% |
| DBB | Base Metals | 12.1% | 18.1% | 10.1% |
| USO | Oil | 1.1% | 1.6% | 19.4% |
| BITO | Bitcoin | (17.3%) | 66.5% | 36.0% |
Disclaimer
The views and opinions expressed are for informational and educational purposes only as of the date of writing and may change at any time based on market or other conditions and may not come to pass. This material is not intended to be relied upon as investment advice or recommendations, does not constitute a solicitation to buy or sell securities and should not be considered specific legal, investment or tax advice. The information provided does not take into account the specific objectives, financial situation, or particular needs of any specific person. All investments carry a certain degree of risk and there is no assurance that an investment will provide positive performance over any period of time. Equity investments are subject to market risk or the risk that stocks will decline in response to such factors as adverse company news or industry developments or a general economic decline. Debt or fixed income securities are subject to market risk, credit risk, interest rate risk, call risk, tax risk, political and economic risk, and income risk. As interest rates rise, bond prices fall. Non-investment-grade bonds involve heightened credit risk, liquidity risk, and potential for default. Foreign investing involves additional risks, including currency fluctuation, political and economic instability, lack of liquidity and differing legal and accounting standards. These risks are magnified in emerging markets. Past performance is no guarantee of future results.