INTRODUCTION
“Volatility is the price of admission. The prize inside are superior long-term returns. You have to pay the price to get the returns.”
– Morgan Housel
Short-term stock market investing is not for the faint of heart. In April, we were reminded once again that stocks can suffer substantial mark-to-market losses in a very short period. During these times, it is prudent to avoid converting a temporary loss into a permanent one by selling. Furthermore, if you have additional capital to invest, you should consider buying during market downturns.
This approach may seem counterintuitive in the moment, and there is always a compelling reason why “it’s different this time.” However, companies eventually adapt to new realities, investors exhaust their selling positions, and markets return to focusing on fundamentals. Time has consistently proven to heal market wounds.
The incentive structures in our political and economic system create an environment that has historically pushed stock prices higher over time. Politicians implement spending policies to create conditions that support their re-election; the Federal Reserve targets 2% inflation to encourage growth and investment while maintaining confidence in the dollar; and CEOs are incentivized to increase their company’s revenue, earnings, and stock price.
What made April particularly concerning was that some core elements of our system appeared to be under attack. Fortunately, President Trump reached his threshold for market pain and provided relief through the 90-day tariff delay, as we had anticipated in our client communications. We identified this as a self-inflicted policy wound that could be quickly reversed.
Financial markets are inherently dynamic, with perpetual sources of concern and excitement. Allowing emotions or political preferences to drive investment decisions will ultimately harm your portfolio’s long-term growth potential. The key is to think long-term and maintain balanced decision-making.
Thank you to our wonderful clients for sticking with us through another exciting moment in the financial markets!
Sincerely,
Jonathan R. Heagle, CFP®, CFA
President and Chief Investment Officer
QUARTERLY ROUNDUP
Market Performance Overview
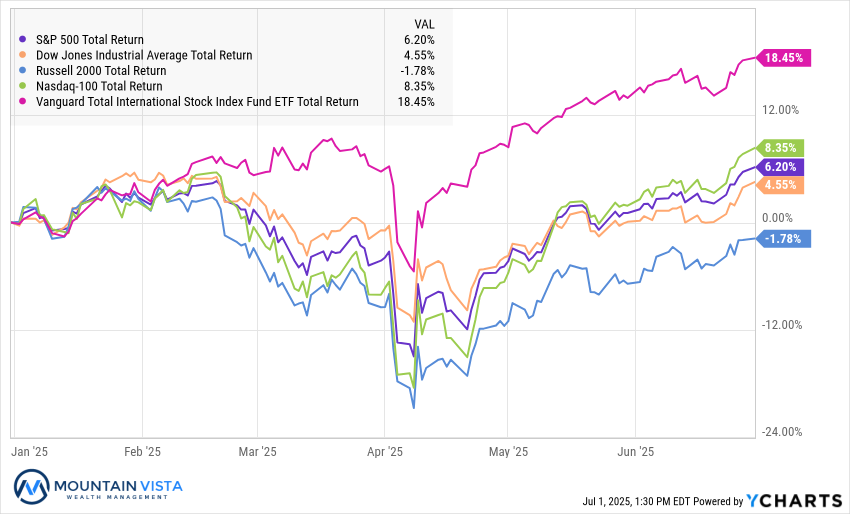
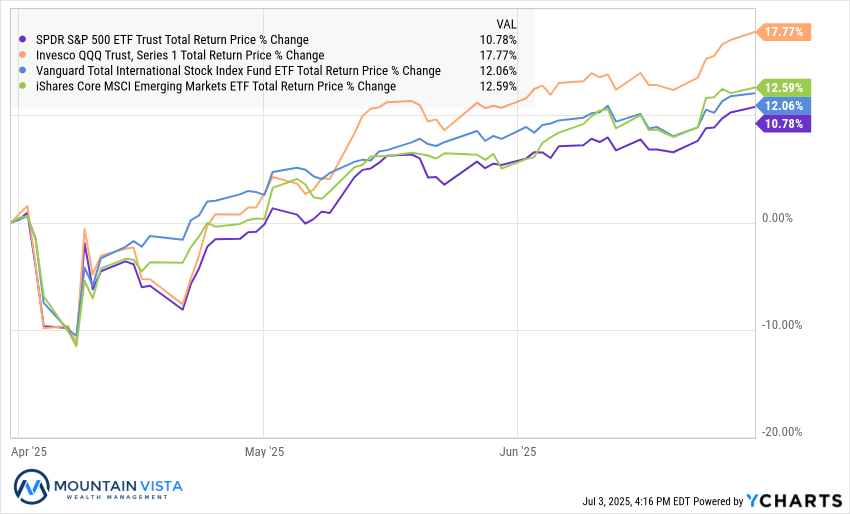
In the second quarter, the S&P 500 and Nasdaq 100 returned 10.9% and 17.9%, respectively, bringing their year-to-date tallies to 6.2% and 8.4%. While these returns look impressive, international stocks have significantly outperformed U.S. markets, with VXUS (International ex-U.S. ETF) returning 18.4% year-to-date and 12.1% in the quarter.
Figure 1: U.S. Stock Market Indices vs. VXUS Total Return Year-to-Date
The strong quarterly returns mask the extreme volatility that investors endured in early April. From March 31st to April 8th, the S&P 500 and Nasdaq 100 dropped 11%, while the Russell 2000 fell 12%. These losses were triggered by the announcement of “reciprocal tariffs” by President Trump on April 2nd, which he termed “Liberation Day.” The subsequent market recovery began after President Trump moderated his stance, announcing a 90-day pause on tariff implementation for countries negotiating in good faith. While only a week passed between the initial announcement and the reversal, it felt considerably longer to those monitoring the markets closely.
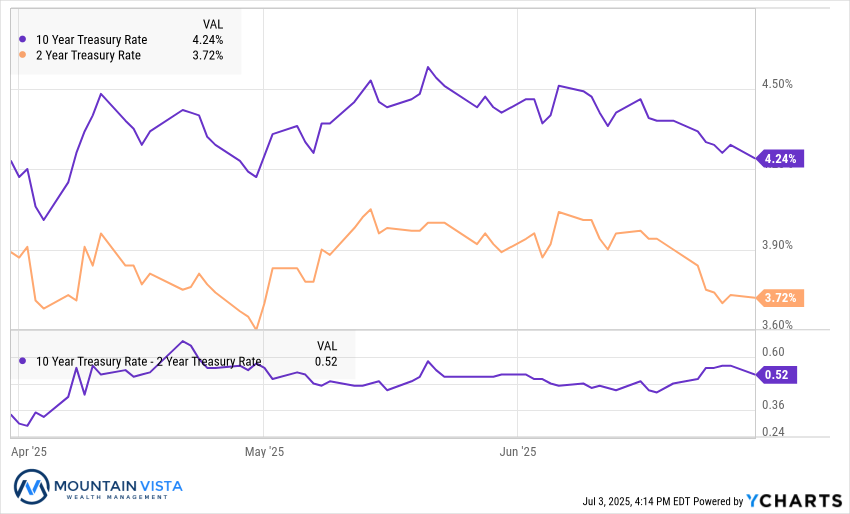
Fixed income had a less intuitive reaction to the April turmoil. Initially, the 10-year U.S. Treasury yield rallied approximately 20 basis points in a flight to safety. However, those gains quickly reversed as investors abandoned bonds and the U.S. dollar, driving the 10-year yield from 4% to 4.6% by May 21st. The 10-year yield ultimately ended the quarter at 4.24%, essentially unchanged from where it began.
The U.S. dollar, as measured by the ICE U.S. Dollar Index, declined 7% in the quarter and is down 12% year-to-date due to several factors: foreign repatriation of assets following Liberation Day, concerns about Federal Reserve independence, and expectations of expanding deficits from proposed tax cuts. This dollar weakness provided a boost to Bitcoin and Gold while creating a tailwind for international stocks.
The VIX, a market-based measure of U.S. stock volatility, reached approximately 60 intraday during the Liberation Day sell-off—the highest reading since March 2020 when COVID uncertainty was driving stocks rapidly lower. The VIX ultimately settled back to 16.7 by quarter-end.
V-Shaped Recovery in U.S. Stocks
In our Q1 Investment Letter, we highlighted the typical strong market performance following rapid 10% market declines. Historically, returns have been positive and strong over the following 3, 6 and 12-month periods.
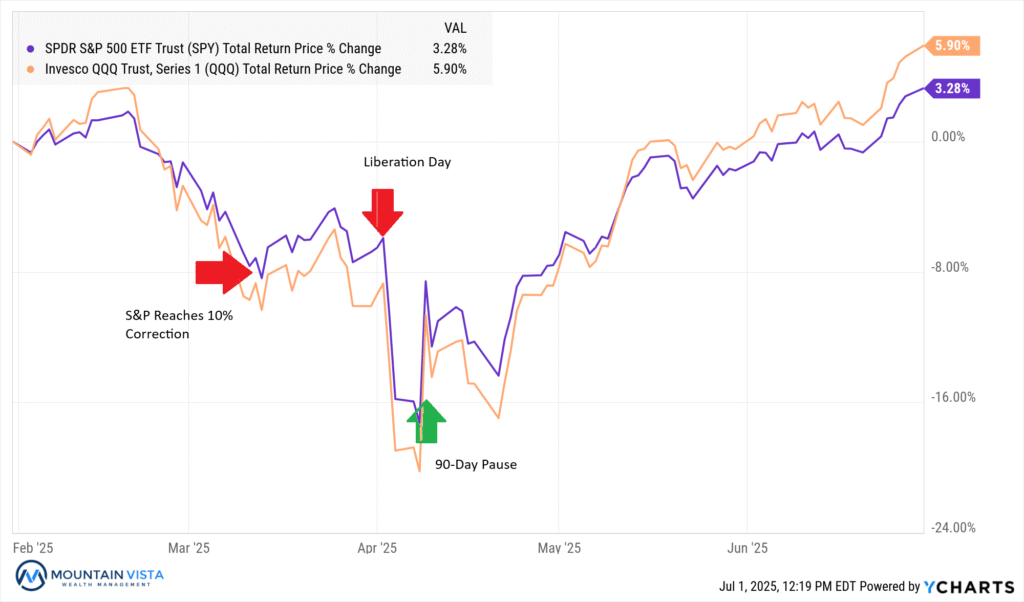
SPY (S&P 500 ETF) reached a 10% correction on March 13th. While stocks continued to fall in the post Liberation Day sell-off, touching a 20% decline, SPY has returned 13% since. QQQ (Nasdaq 100 ETF) faired even better and has returned 18%.
Figure 2: Stocks V-Shaped Recovery After Rapid Decline
Strong Returns After “Near” Bear Markets
The S&P 500 fell almost 20% from its February peak in less than two months during March and April. Historically, when the S&P 500 has suffered a “near” bear market (bottoming just before reaching a 20% pullback), average one-year returns were 13.4% and were positive 100% of the time.
Furthermore, the S&P 500 subsequently rallied over 20% in less than two months. In prior instances of 20%+ rallies in two months or less, the average one-year return was 23.7% with positive performance 100% of the time.
Figure 3: S&P 500 Returns after “Near” Bear Market Lows and Quick 20%+ Rallies
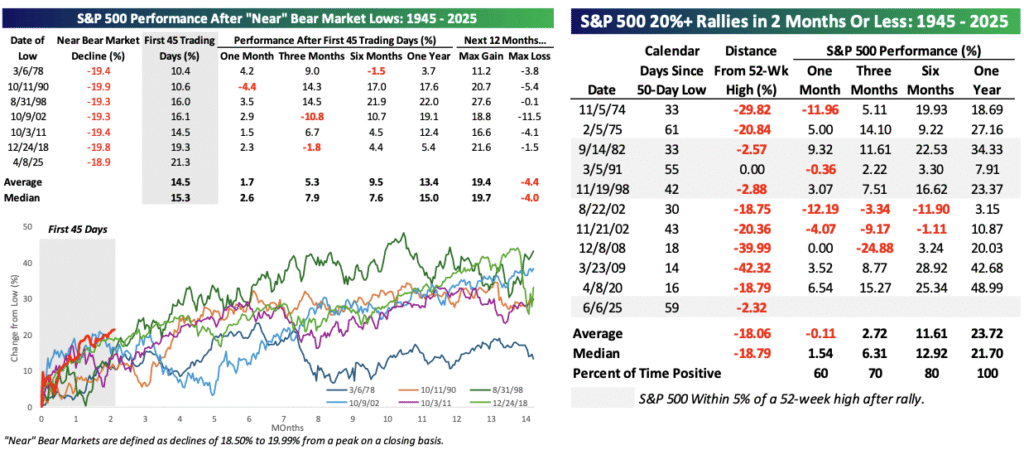
Source: Bespoke Investment Group
While this historical context does not guarantee good performance over the next year, it shows that the market can continue to deliver strong returns despite how far the market has come since the April lows.
Diversifiers Paying off in 2025
Over the past 15 years, U.S. large-cap technology stocks have delivered exceptional returns that have far outpaced international equities, gold, bonds, and even other U.S. sectors. Bitcoin stands as the notable exception, though it was emerging from its infancy 15 years ago and had not yet achieved the institutional acceptance it enjoys today.
Entering 2025, many professional and retail investors had begun questioning whether diversification beyond U.S. equities was necessary. The prevailing argument suggested that U.S. large-cap companies already provide global exposure through their worldwide revenue streams. However, President Trump’s unilateral tariff announcement served as a stark reminder that country-specific risks remain relevant and has thrust the importance of diversification back into the spotlight.
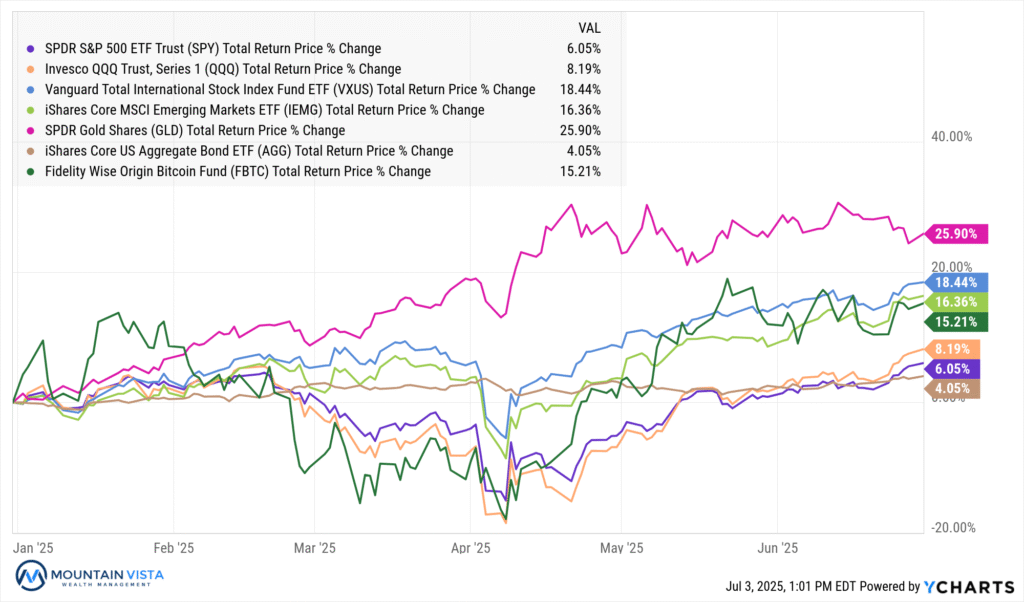
This year’s performance has validated the diversification argument. While the S&P 500 and Nasdaq 100 have posted mid-single-digit returns year-to-date, gold, international stocks, emerging markets, and Bitcoin have generated returns ranging from the teens to mid-20s. The weakening U.S. dollar has created a favorable environment for non-dollar assets, providing a powerful tailwind for diversified portfolios.
Figure 4: Year-to-Date Total Returns of Various Asset Classes
Capital Markets Opening Up
Coming into 2025, many expected a meaningful pickup in initial public offerings of private companies. The tariff-induced volatility likely put many companies’ plans on hold, but there are encouraging signs for the remainder of the year.
First, the price performance of several marquee IPOs has been exceptionally strong. CoreWeave, which priced its shares at $40 in the IPO, has seen its stock rise as much as 359% from the offering price. Circle priced its IPO at $31 and watched its shares soar to just under $300 in less than a month—a nearly 900% gain.
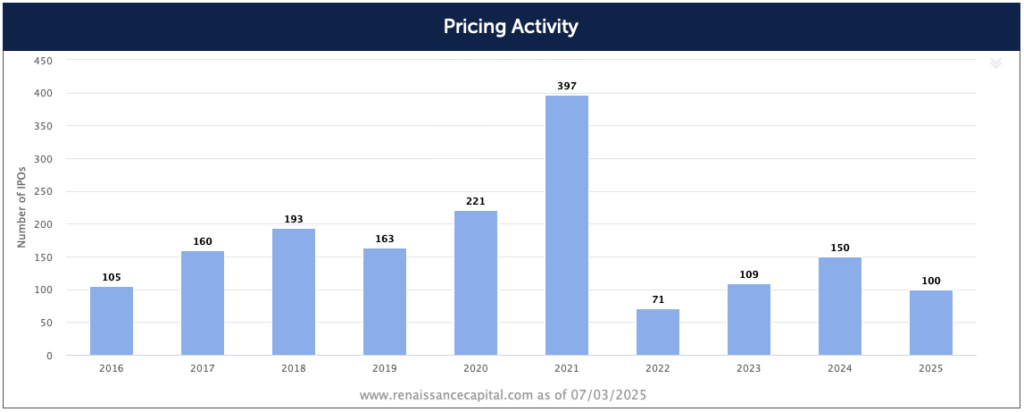
Second, despite the April volatility, there have been 100 IPOs in the first half of 2025, according to Renaissance Capital. If this pace continues, 2025 could become the most prolific year for IPOs since the 2021 boom.
Figure 5: IPO Pricings by Year
The combination of strong post-IPO performance and robust issuance volume suggests that both companies and investors are finding opportunities in the public markets, even amid broader market uncertainty. Several high-profile private companies could go public at any time, including Stripe, Databricks, Klarna, Anduril, and SpaceX, among others.
Investors should monitor developments in the IPO market closely, as it can serve as a signal of both market health and speculative excess.
Looking Forward
There are compelling reasons to be both optimistic and cautious about the stock market moving forward. On the positive side, the Republican tax agenda is likely to pass, inflation has remained subdued, and the extremely high tariffs from Liberation Day are unlikely to be implemented. Furthermore, some members of the Federal Open Market Committee have spoken favorably about interest rate cuts.
On the negative side, valuations are elevated again, with the Forward Price-to-Earnings ratio of the S&P 500 back in the low-to-mid 20s. Additionally, labor market, housing market, and consumer data all suggest a cooler economic environment. Finally, Federal Reserve Chairman Jerome Powell has been resistant to lowering interest rates until he is certain that tariffs will not prove inflationary, increasing recession odds.
We believe the recent economic data reflects the uncertainty following Liberation Day. With the stock market recovering and yields off their highs, the weak data may represent just a temporary soft patch. Furthermore, the positive effects from tax reform, deregulation, and interest rate cuts should support the economy in the coming months and quarters.
Taken together, this leaves us neutral on the stock market. We do not see an immediate economic crash, but valuations are toward the high end of their historical range, leaving the market vulnerable to disappointment and unexpected events.
Should the back end of the yield curve sell off meaningfully due to persistently high U.S. deficits, a dollar crash, and/or a loss of Federal Reserve credibility, our benign view could be at risk. This is not our base case, but it represents a meaningful risk to monitor.
Fixed income is unlikely to provide significant price appreciation in the short term, but current yield levels offer attractive income and provide ballast and liquidity to portfolios.
Gold and Bitcoin remain in a favorable position given the weakness in the U.S. dollar and the failure of either party to meaningfully address the U.S. deficit.
We appreciate your review of this analysis and welcome any questions regarding these observations or other financial matters of interest.
APPENDIX
Equity Index ETF Total Return
| ETF | Description | Q2 2025 Total Return | Since April 8, 2025 | 2025 Total Return |
| SPY | S&P 500 | 10.8% | 24.8% | 6.1% |
| QQQ | Nasdaq 100 | 17.8% | 32.7% | 8.2% |
| IWM | Russell 2000 | 8.5% | 23.8% | (1.9%) |
| IVW | S&P 500 Growth | 18.7% | 32.9% | 8.7% |
| IVE | S&P 500 Value | 3.0% | 16.6% | 3.2% |
| VXUS | International Ex-US | 12.1% | 25.3% | 18.4% |
| IEMG | Emerging Markets | 12.6% | 27.3% | 16.4% |
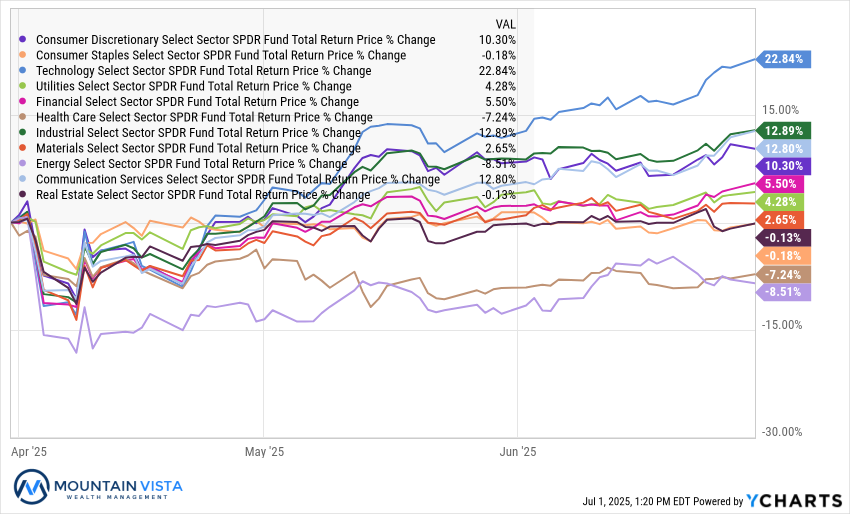
U.S. Equity Sector Total Return
| ETF | Description | Q2 2025 Total Return | Since April 8, 2025 | 2025 Total Return |
| XLK | Technology | 22.8% | 41.1% | 9.3% |
| XLI | Industrials | 12.9% | 27.1% | 12.6% |
| XLC | Communications | 12.8% | 26.3% | 12.7% |
| XLY | Consumer Disc | 10.3% | 23.5% | (2.7%) |
| IYZ | Telecom | 9.2% | 21.9% | 12.2% |
| XLF | Financials | 5.5% | 19.6% | 9.1% |
| XLU | Utilities | 4.3% | 12.5% | 9.4% |
| XLB | Materials | 2.6% | 18.8% | 5.4% |
| XLRE | Real Estate | (0.1%) | 12.7% | 3.4% |
| XLP | Consumer Staples | (0.2%) | 6.8% | 4.3% |
| XLV | Healthcare | (7.2%) | 1.8% | (1.2%) |
| XLE | Energy | (8.5%) | 11.9% | 0.6% |
U.S. Equity Sector Total Return
Global Equity ETF Total Return
Fixed Income ETF Total Return
| ETF | Description | Q2 2025 Total Return | Since April 8, 2025 | 2025 Total Return |
| AGG | Aggregate Bond | 1.3% | 2.2% | 4.0% |
| BND | Total Bond Market | 1.2% | 2.2% | 4.0% |
| LQD | IG Corporate | 2.0% | 4.9% | 4.6% |
| JNK | HY Corporate | 3.8% | 7.8% | 4.8% |
| EMB | $ EM Bonds | 3.6% | 8.0% | 6.4% |
| SHY | 1-3 Yr Treasuries | 1.1% | 0.9% | 2.7% |
| IEF | 7-10 Yr Treasuries | 1.4% | 1.5% | 5.2% |
| TLT | 20+ Yr Treasuries | (2.0%) | 0.6% | 2.9% |
| TIP | TIPs | 0.4% | 1.7% | 4.7% |
U.S. Treasury Yields and 2/10 Spread
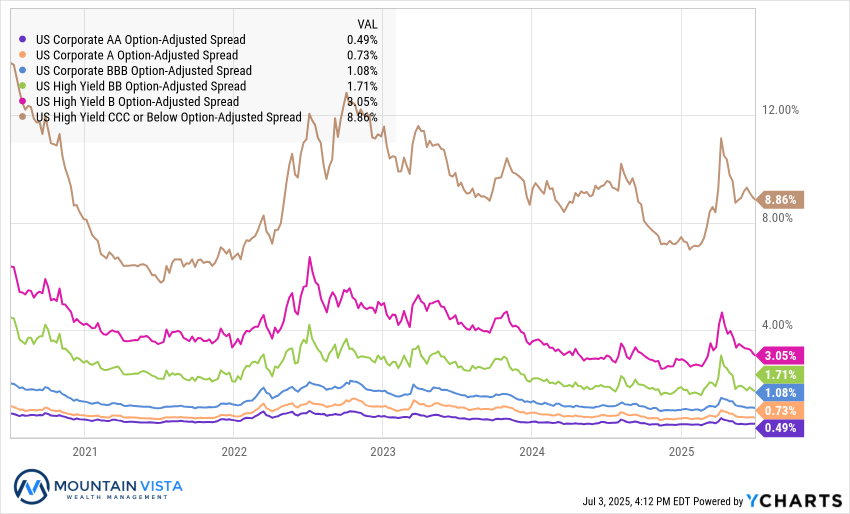
U.S. Corporate Credit Spreads
Commodity and Bitcoin Total Return
| ETF | Description | Q2 2025 Total Return | Since April 8, 2025 | 2025 Total Return |
| PDBC | Diversified Commodity | (4.3%) | 6.8% | 0.4% |
| GLD | Gold | 5.8% | 10.8% | 25.9% |
| DBB | Base Metals | 0.9% | 12.4% | 2.8% |
| USO | Oil | (5.5%) | 15.4% | (3.2%) |
| FBTC | Bitcoin | 30.6% | 40.3% | 129.9% |
Disclaimer
The views and opinions expressed are for informational and educational purposes only as of the date of writing and may change at any time based on market or other conditions and may not come to pass. This material is not intended to be relied upon as investment advice or recommendations, does not constitute a solicitation to buy or sell securities and should not be considered specific legal, investment or tax advice. The information provided does not take into account the specific objectives, financial situation, or particular needs of any specific person. All investments carry a certain degree of risk and there is no assurance that an investment will provide positive performance over any period of time. Equity investments are subject to market risk or the risk that stocks will decline in response to such factors as adverse company news or industry developments or a general economic decline. Debt or fixed income securities are subject to market risk, credit risk, interest rate risk, call risk, tax risk, political and economic risk, and income risk. As interest rates rise, bond prices fall. Non-investment-grade bonds involve heightened credit risk, liquidity risk, and potential for default. Foreign investing involves additional risks, including currency fluctuation, political and economic instability, lack of liquidity and differing legal and accounting standards. These risks are magnified in emerging markets. Past performance is no guarantee of future results.