INTRODUCTION
“AI has the potential to be one of the greatest transformational technologies of all time…That’s not the same as saying AI Investments are on the bargain counter or even fairly priced.”
– Howard Marks, Oaktree Capital
Artificial intelligence is already having a profound impact on our markets and economy. But it will increasingly impact politics and various aspects of our day-to-day lives that we cannot yet imagine. Because of the transformative nature of the technology, speculation and volatility have increased in public and private markets. We have seen remarkable gains in stocks that touch the datacenter build out and promise transformative products yet to be built.
Many market commentators are trying to predict what “inning” the AI bull market is in or if it is already a speculative bubble that will burst fantastically. Rather than play the game of trying to call the top or chasing a rally (market timing), I would encourage everyone to stay diversified and thoughtful about their risk tolerance.
Rebalancing your portfolio periodically to a target asset allocation, allows you to lock in gains in equities during bull markets and “buy the dip” during the inevitable pull back. It also keeps you from being overexposed to the stock market before a correction or underexposed at the start of a new bull market.
Finally, staying diversified allows you to participate in the market’s big winners without constantly wondering if you should take profits or if the good times have ended. There are plenty of people that have owned Apple, Nvidia or Micron at some point in time, but far fewer have held on through the rollercoaster ride to achieve their eye-popping long-term returns. Missing one of these massive winners or selling them too early can cause you to underperform over time. Holding an index fund guarantees participation.
We’re grateful to work with such thoughtful, engaged clients, and we never take your trust for granted. Thank you for allowing us the privilege of safeguarding your hard-earned savings.
Sincerely,
Jonathan R. Heagle, CFP®, CFA
President and Chief Investment Officer
QUARTERLY ROUNDUP
Market Performance Overview
The second quarter was defined by a powerful recovery in risk assets, led by technology, growth stocks, small caps, and emerging markets. However, the year-to-date results show a more nuanced picture. Some areas that struggled in the quarter, such as energy and oil, still retained strong gains for the year, while other segments, including communications services, consumer discretionary, financials, gold, and digital assets, remained under pressure. Fixed income continued to provide stability, though returns were modest. As always, these divergences underscore the importance of maintaining a diversified portfolio rather than relying on any single asset class, sector, or market theme.
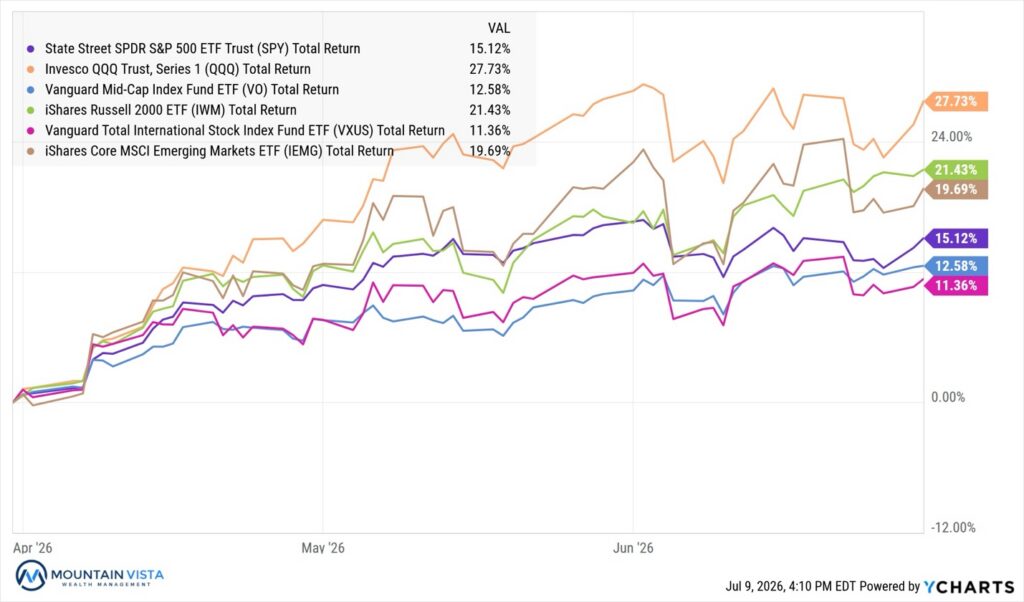
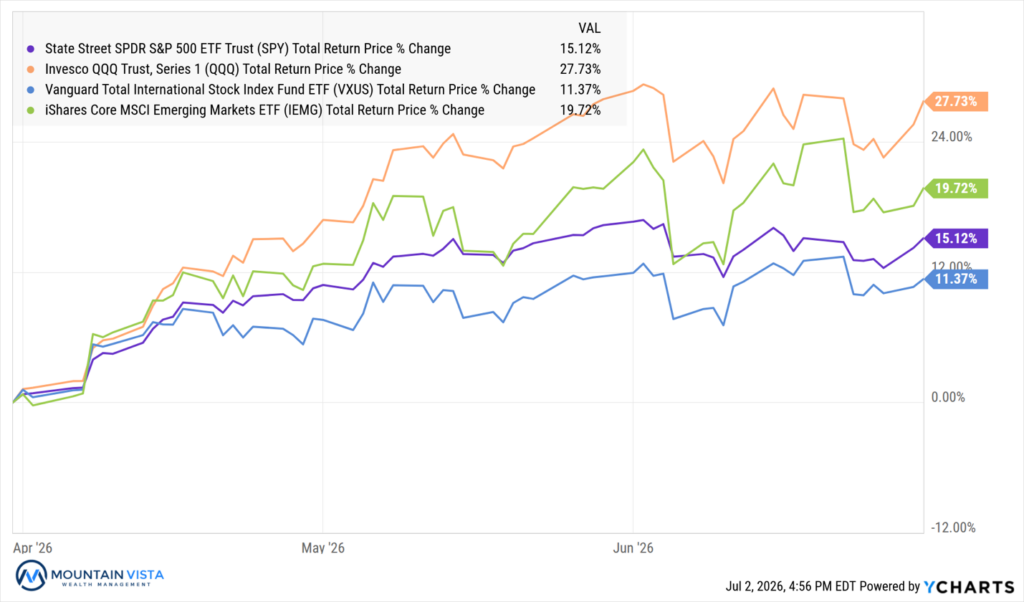
U.S. equities posted broad gains, with the S&P 500 (SPY) rising 15.1% for the quarter and 10.1% year-to-date. Growth stocks resumed leadership, as the Nasdaq 100 (QQQ) gained 27.7% in Q2 and S&P 500 Growth (IVW) rose 21.7%, well ahead of S&P 500 Value (IVE), which gained 8.0%. Small caps also participated meaningfully, with the Russell 2000 (IWM) up 21.4% for the quarter and 22.6% year-to-date.
International markets continued to perform well, with developed international stocks (VXUS) up 11.4% in Q2 and emerging markets (IEMG) up 19.7%. Year-to-date, emerging markets (IEMG) remained one of the strongest major equity categories, gaining 24.2%.
Figure 1: Domestic and International Equity Index ETF Returns
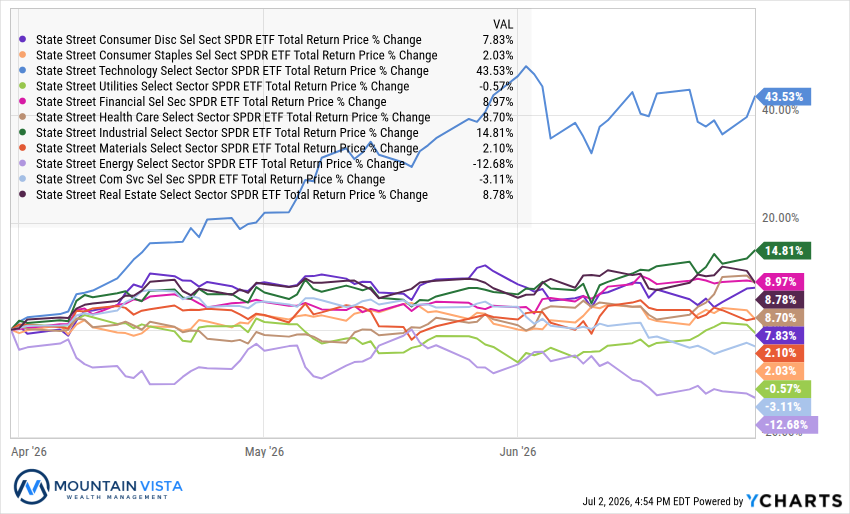
Sector performance was highly concentrated. Technology (XLK) was the clear standout, surging 43.5% in the quarter, because of very strong earnings growth, and 32.7% year-to-date. Industrials (XLI) also remained strong, up 14.8% in Q2 and 20.0% year-to-date. Energy (XLE) moved in the opposite direction during the quarter, falling (-12.7%) as tensions in Iran cooled and oil prices declined, though it remained up 20.4% for the year after earlier strength. Communications Services (XLC) was the weakest year-to-date sector, down (-8.5%).
Fixed income produced modest positive returns, providing stability but little upside. The broad U.S. bond market (AGG) gained 0.7% in the quarter and year-to-date. Credit-sensitive areas performed somewhat better, with high-yield bonds (JNK) up 2.3% in Q2 and emerging market bonds (EMB) up 4.1%, while Treasury returns were generally muted.
Commodity returns were volatile. Oil (USO) declined (-16.4%) in Q2 but remained up 53.9% year-to-date, highlighting the sharp reversal from earlier strength. Diversified commodities (PDBC) fell (-8.3%) in the quarter but were still up 19.8% for the year. Gold (GLD) declined (-14.4%) in Q2, while digital assets remained under pressure, with Bitcoin (FBTC) down (-13.5%) and Ethereum (ETHA) down
(-24.9%) for the quarter.
SpaceX IPO and Pipeline
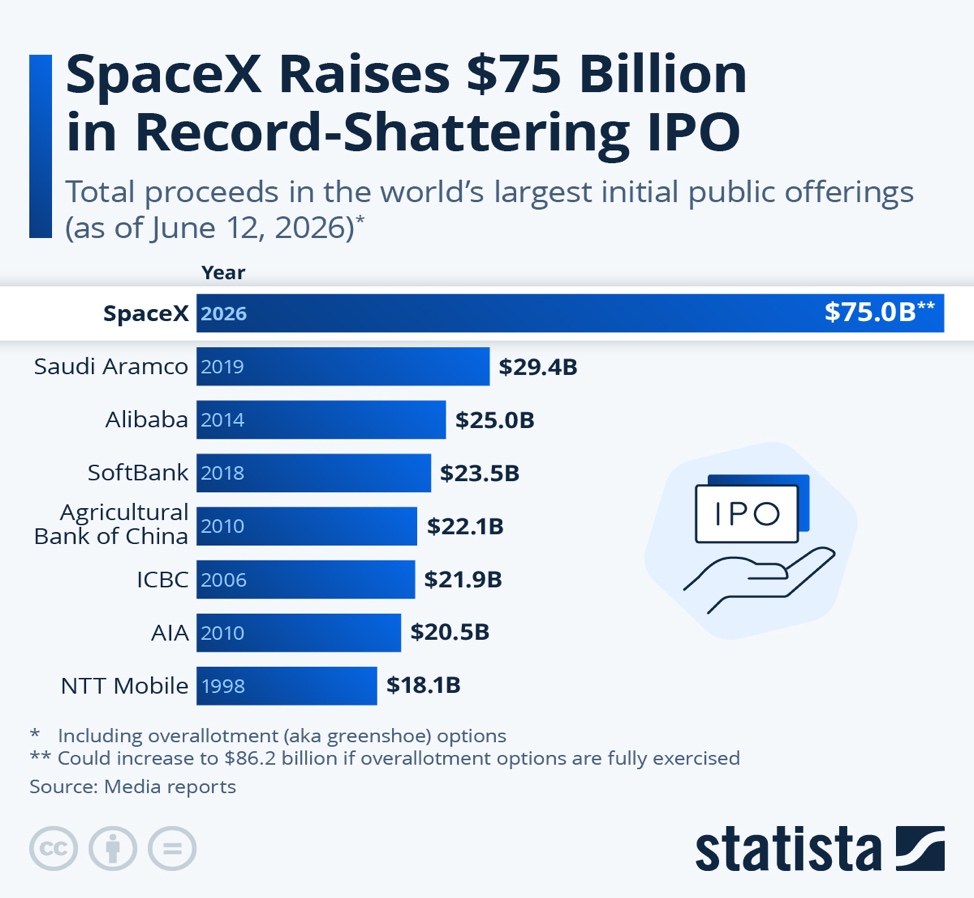
The most notable capital markets event of the quarter was SpaceX’s record-breaking initial public offering. The company priced its IPO at $135 per share, raising roughly $75 billion at an implied valuation of about $1.75 trillion, making it more than double the second largest IPO on record. Shares opened at $150 and closed their first day at $160.95, pushing the company’s market value above $2 trillion and immediately placing SpaceX among the largest public companies in the world. The stock peaked at $225 before settling down to ~$150.
The valuation is remarkable relative to current fundamentals. SpaceX generated approximately $18.7 billion of revenue in 2025, meaning the IPO valuation represented roughly 94 times trailing revenue, while the subsequent market capitalization above $2 trillion implied an even higher multiple. The valuation relies less on current revenues and more on ambitious expectations for Starlink, launch services, and especially AI, with Goldman Sachs reportedly projecting total revenue of $474 billion by 2030, including $322 billion from the AI unit. While the combined TAM of the company’s business lines is massive, there is definitive execution risk at these valuations.
The performance of this IPO was watched very carefully as a barometer for the broader IPO pipeline, which includes Anthropic and OpenAI. Both companies have confidentially filed for U.S. public offerings and could test investor appetite for large, AI-driven valuations.
Figure 2: Largest IPOs of All Time
A Record Quarter for Semiconductors
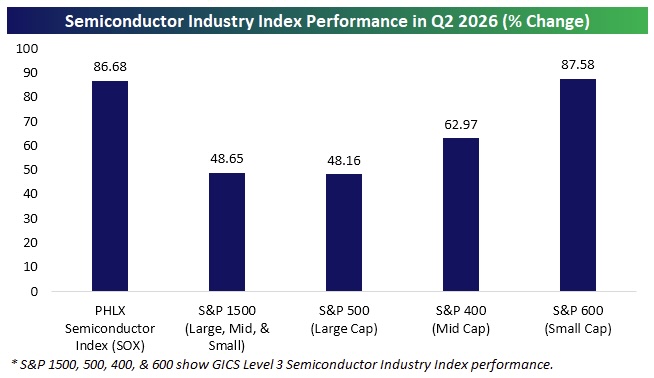
While the performance of overall technology (XLK) was impressive in the second quarter, returning 43.5%, Semiconductor performance was even more impressive. Depending on the semiconductor index chosen, the quarterly returns ranged from 48% to 88%. This is despite Nvidia and Broadcom generating only 12% and 21% quarterly returns, respectively.
Driving these strong returns were a combination of positive earnings revisions, continued AI infrastructure spending by the hyperscalers and supply-driven pricing increases.
At the end of Q2, the SOXX ETF sat 172% above its 200-day moving average. With many semiconductor stocks up over 100% in a short period of time, it would not be surprising to see consolidation over the coming months.
Figure 3: Quarterly Return of Various Semiconductor Indices
Source: Bespoke Investment Group
New Fed Chair, Same Inflation Problem
The second quarter brought a meaningful leadership transition at the Federal Reserve. Jerome Powell’s tenure as Chair formally came to an end in May, with the Board briefly naming him chair pro tempore until Kevin Warsh was sworn in. Warsh took the oath of office on May 22, beginning a four-year term that runs through May 2030.
Warsh has been an outspoken critic on the evolving mandate and practices of the Federal Reserve that have taken place post Global Financial Crisis. He is looking to reform the institution, rather than simply conduct monetary policy.
Warsh’s first FOMC meeting, held June 16–17, was notable less for what the Fed did than for how it communicated. The Committee voted unanimously to keep the federal funds target range unchanged at 3.50%–3.75%, but the statement was shorter, more direct, and notably absent of the easing bias that had appeared in earlier communications. Warsh also used his first press conference to announce five new task forces focused on Fed communications, the balance sheet, data sources, productivity and jobs in an era of technological change, and the inflation framework.
Figure 4: Federal Reserve Summary of Economic Projections, June FOMC
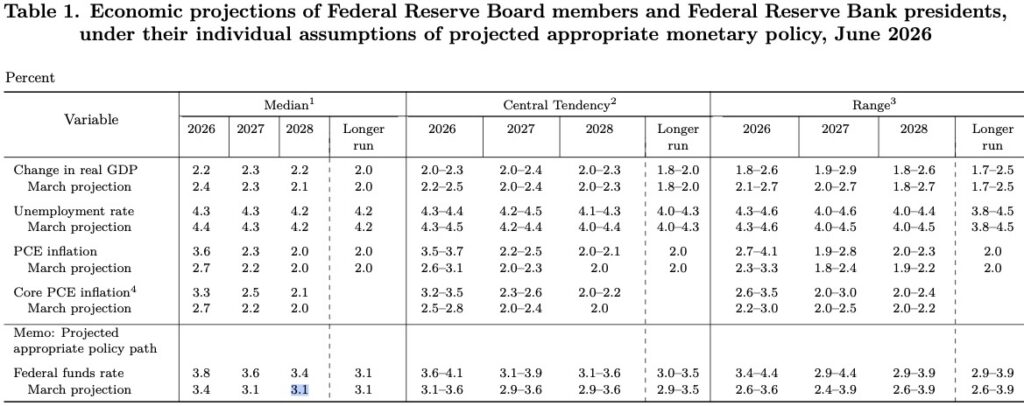
Markets have adjusted quickly to this shift. Early in the year, investors were still pricing in one to two 25 basis point rate cuts for 2026, reflecting confidence that inflation would continue to cool. By late June, that narrative had flipped: futures markets were assigning roughly a 30% chance of a July hike and about an 80% chance of a September hike.
Looking Forward
With earnings growing at a healthy pace, tensions in the Middle East easing, and lower oil prices potentially reducing inflationary pressures, it is difficult to be overly pessimistic about the market outlook. Nevertheless, equities have advanced substantially since the beginning of the quarter, and we are becoming more cautious about the amount of investor capital being absorbed by IPOs, debt issuance, and stock offerings from large hyperscalers. These financing needs may divert funds from existing securities and create a near-term headwind for markets. In addition, the approaching midterm elections could introduce a period of heightened volatility. In light of these factors, we have modestly reduced our equity exposure in growth-oriented portfolios.
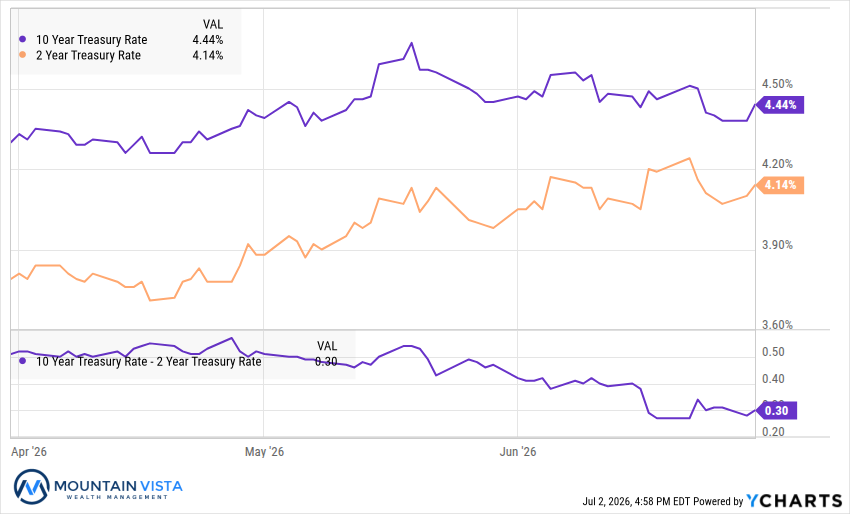
We are neutral on Fixed Income as expectations for rate hikes has driven treasury rates higher, while falling oil prices could put downward pressure on inflation in the near-term. A 4.5% yield on the 10-year U.S. Treasury seems fairly valued.
In commodities, both Gold and Bitcoin are in bear markets, with the former down (-25.7%) and the latter down (-53.3%)from their respective highs. While we could point to real rates, a strong dollar, Fed Chair Warsh’s desire to shrink the balance sheet, or quantum hacking risk (in the case of Bitcoin), it feels like the weakness is mostly due to a shift in speculative dollars towards technology stocks and IPOs. There may be more downside in the near-term, but patient capital may be rewarded over time from these levels.
We appreciate your review of this analysis and welcome any questions regarding these observations or other financial matters of interest.
APPENDIX
Equity Index ETF Total Return
| ETF | Description | Q2 2026 Total Return | 2026 Total Return |
| SPY | S&P 500 | 15.1% | 10.1% |
| QQQ | Nasdaq 100 | 27.7% | 20.2% |
| IWM | Russell 2000 | 21.4% | 22.6% |
| IVW | S&P 500 Growth | 21.7% | 11.8% |
| IVE | S&P 500 Value | 8.0% | 7.9% |
| VXUS | International Ex-US | 11.4% | 13.9% |
| IEMG | Emerging Markets | 19.7% | 24.2% |
U.S. Equity Sector Total Return Table
| ETF | Description | Q2 2026 Total Return | 2026 Total Return |
| XLK | Technology | 43.5% | 32.7% |
| XLI | Industrials | 14.8% | 20.0% |
| XLF | Financials | 9.0% | (1.3%) |
| XLRE | Real Estate | 8.8% | 10.8% |
| XLV | Healthcare | 8.7% | 3.4% |
| IYZ | Telecom | 8.0% | 25.7% |
| XLY | Consumer Disc | 7.8% | (1.4%) |
| XLB | Materials | 2.1% | 13.0% |
| XLP | Consumer Staples | 2.0% | 8.3% |
| XLU | Utilities | (0.6%) | 7.6% |
| XLC | Communications | (3.1%) | (8.5%) |
| XLE | Energy | (12.7%) | 20.4% |
U.S. Equity Sector Total Return Chart
Global Equity ETF Total Return
Fixed Income ETF Total Return
| ETF | Description | Q2 2026 Total Return | 2026 Total Return |
| AGG | Aggregate Bond | 0.7% | 0.7% |
| BND | Total Bond Market | 0.7% | 0.7% |
| LQD | IG Corporate | 1.3% | 0.9% |
| JNK | HY Corporate | 2.3% | 1.9% |
| EMB | $ EM Bonds | 4.1% | 2.4% |
| SHY | 1-3 Yr Treasuries | 0.3% | 0.6% |
| IEF | 7-10 Yr Treasuries | 0.1% | (0.1%) |
| TLT | 20+ Yr Treasuries | 0.9% | 1.0% |
| TIP | TIPs | 0.8% | 1.2% |
U.S. Treasury Yields and 2/10 Spread
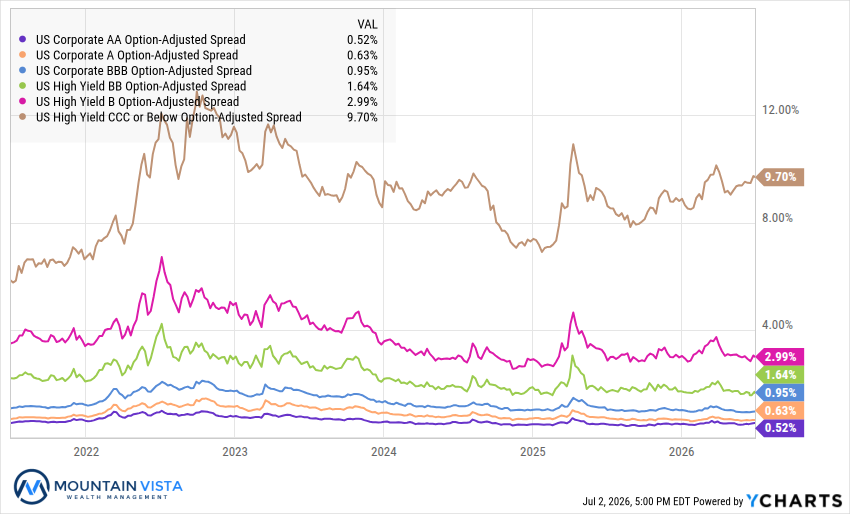
U.S. Corporate Credit Spreads
Commodity and Bitcoin Total Return
| ETF | Description | Q2 2026 Total Return | 2026 Total Return |
| PDBC | Diversified Commodity | (8.3%) | 19.8% |
| GLD | Gold | (14.4%) | (7.0%) |
| DBB | Base Metals | 2.6% | 5.1% |
| USO | Oil | (16.4%) | 53.9% |
| FBTC | Bitcoin | (13.5%) | (33.0%) |
| ETHA | Ethereum | (24.9%) | (47.0%) |
Disclaimer
The views and opinions expressed are for informational and educational purposes only as of the date of writing and may change at any time based on market or other conditions and may not come to pass. This material is not intended to be relied upon as investment advice or recommendations, does not constitute a solicitation to buy or sell securities and should not be considered specific legal, investment or tax advice. The information provided does not take into account the specific objectives, financial situation, or particular needs of any specific person. All investments carry a certain degree of risk and there is no assurance that an investment will provide positive performance over any period of time. Equity investments are subject to market risk or the risk that stocks will decline in response to such factors as adverse company news or industry developments or a general economic decline. Debt or fixed income securities are subject to market risk, credit risk, interest rate risk, call risk, tax risk, political and economic risk, and income risk. As interest rates rise, bond prices fall. Non-investment-grade bonds involve heightened credit risk, liquidity risk, and potential for default. Foreign investing involves additional risks, including currency fluctuation, political and economic instability, lack of liquidity and differing legal and accounting standards. These risks are magnified in emerging markets. Past performance is no guarantee of future results.