INTRODUCTION
“Markets are constantly in a state of uncertainty and flux and money is made by discounting the obvious and betting on the unexpected.” – George Soros
Everywhere we turn there are postulations and predictions of how we are heading into a recession and how the market is poised for a crash. While there are a number of unsettling developments in the areas of politics, the economy and demographics, it is important to remember that the market is forward looking and discounts what is expected.
If an event is well broadcast and discussed at dining tables around the country, it is unlikely to catch investors off guard. Also, it is important to remember that an unexpected event may be positive for markets. Imagine a new round of quantitative easing, a rebate back to all tax paying citizens, the invention of a new technology that changes our economy, or even a run-of-the-mill upturn in the business cycle.
Reacting to news after the fact is typically a fool’s errand and is one of the main reasons why the average investor has such a hard time executing the “buy low and sell high” strategy. Recency bias is the tendency to allow expectations of what will happen in the future to be influenced by recent experience. If the market has been going down, we have a tendency to believe that it will keep going down. Alternatively, if the market has been going up, we are biased to believe that it will continue to do so. You can see how this pattern ends in tears.
For those with a long-term time horizon, periodically rebalancing your portfolio to a target asset allocation can help to avoid market timing mistakes exacerbated by recency bias. Rebalancing by definition means that you will be selling what has gone up (selling high) and buying what has been going down (buying low). For those in retirement or with a shorter time horizon, more attention must be paid to shoring up the funds required for your basic necessities and living expenses. Only then should they expose their remaining assets to the fluctuations of the market.
Finally, a special thanks to all of our clients for their continued support. We remain focused on delivering long-term investment returns, while taking into account our clients’ goals and risk tolerance. As always, we are available to discuss any questions or concerns that you may have.
Sincerely,

Jonathan R. Heagle
President and CIO
OVERALL MARKET COMMENTARY
There has been a lot of negative news to digest over the last few months. Potential impeachment, forecasts of recession, a drone attack on a Saudi oil field and poorly performing “unicorn” IPOs to name a few. All of that being said the S&P 500 ended the 3rd quarter (-1.6%) below its all-time high. The market’s resiliency has been impressive to say the least.
At the end of most bull markets, we typically see some form of excessive and destabilizing speculation build up in the system. In the late 90’s, it was dotcom stocks and in the mid 2000’s, it was highly levered investment property. Once sanity returned to the market, the losses in the relevant sector were severe. Some will argue that we have been in a bull market since March ’09, making it the longest in history, while others will point out the corrections in 2011 and 2016. Regardless of how long you think the bull market has been running for, there has been a lot of time for excesses to build in this cycle. The growth of private company “unicorns” and the poor performance of some recent IPOs has my risk antennae tingling.
For the last 10 years we have seen a tremendous amount of institutional money pour into the private markets seeking higher, uncorrelated returns. Rather than rushing to bring a successful private company public, as was common in the 90’s, companies have chosen to stay private given the greater flexibility, less rigorous reporting requirements, and copious amount of private funding. Without the pricing transparency of the public market, money losing entities have been able to raise money at eye popping valuations. If the private market bubble pops, we may look at the failed WeWork IPO as the canary in the coal mine.
Figure 1: Number of U.S. IPOs
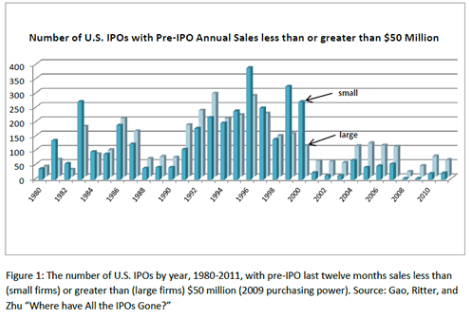
While not directly related to the public market, it is possible that a significant and prolonged drop in the valuation of private companies could impact publicly traded companies. If a portfolio manager needs to raise funds, they will surely choose to sell the holding that has not fallen significantly in price. Also, when evaluating where to allocate future funds, the private company should be more attractive, given their fall in valuation, all else being equal. Finally, psychological damage has been done and sentiment towards stocks with low/negative earnings and high valuations could shift.
Figure 2: Publicly and Privately Funded Technology Unicorns
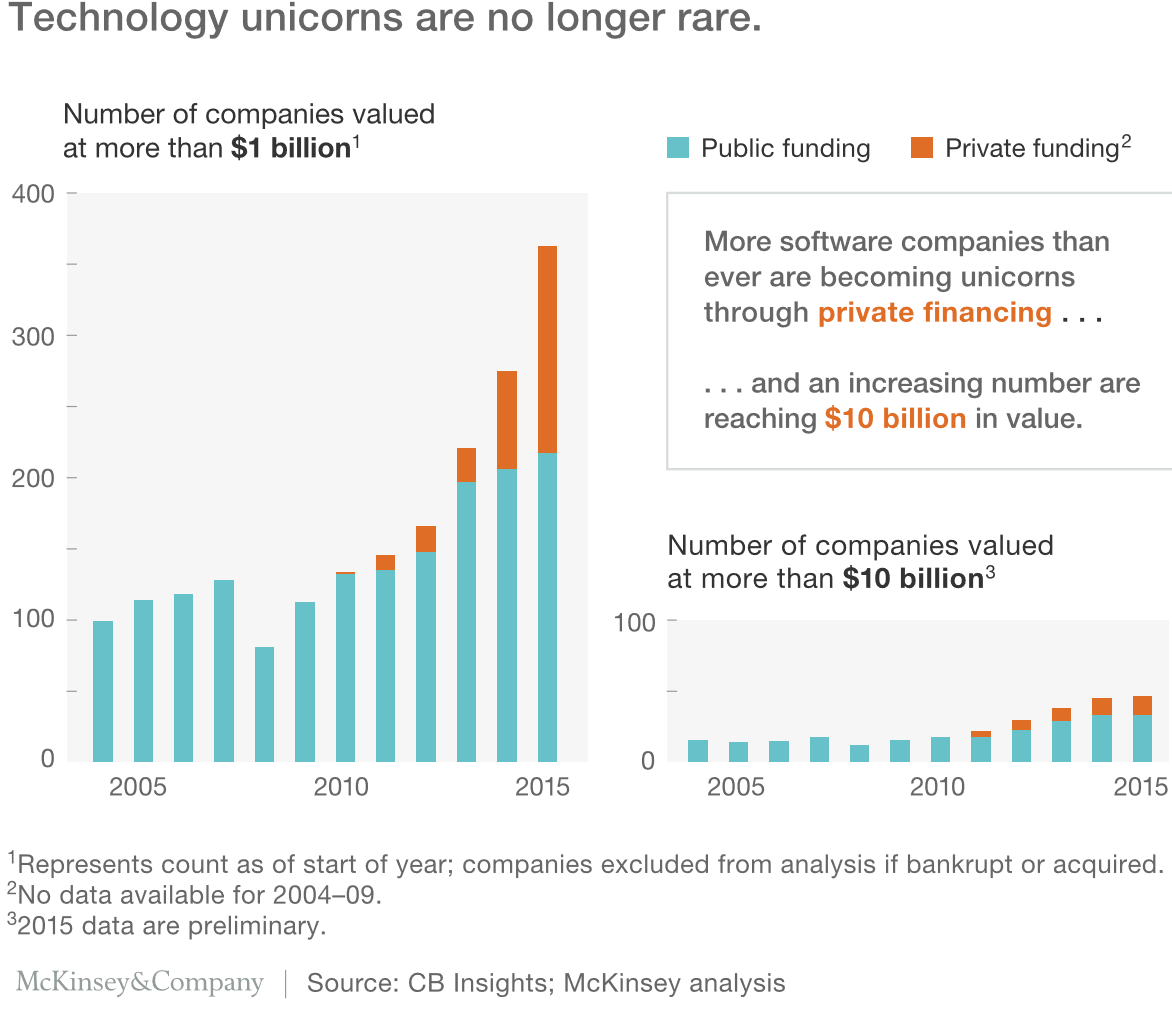
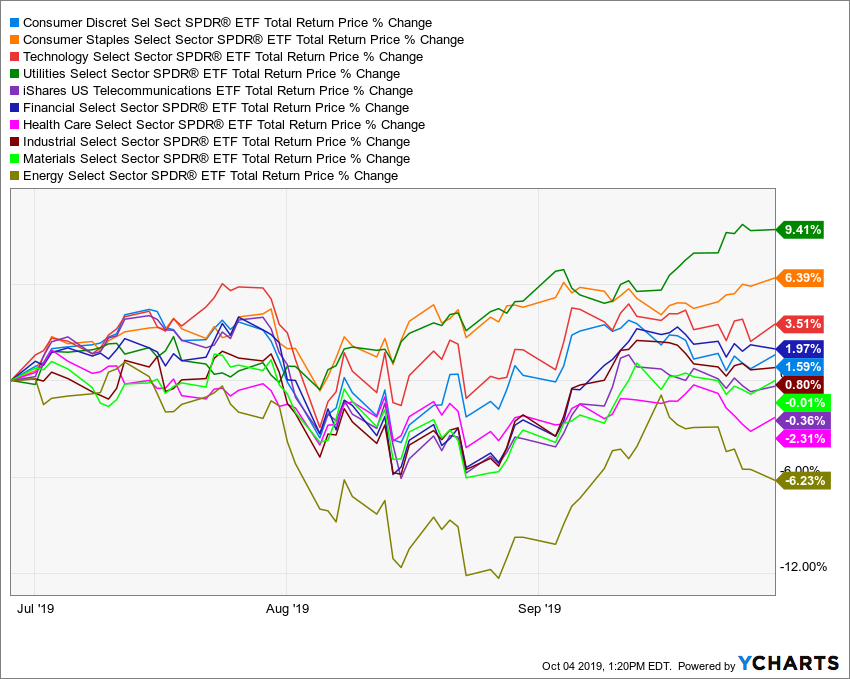
Turning back to the market, the small changes in the equity indices over the quarter masked some large movements amongst asset classes and sectors. The 10-year treasury rate continued to plummet below 2%, reaching as low as 1.47% in early September, before settling in at 1.68% to end the quarter. Also, the dispersion between the best performing equity sector, Utilities at 9.4% QoQ, and the worst performing sector, Energy (-6.2%) was over 15%! Finally, numerous market leading growth stocks, such as SHOP, have seen sharp 20-30% corrections.
While we do not know exactly where the market is headed, we believe that the risk in the market is somewhat elevated at the moment. With the drop in bond yields, it is unlikely that fixed income will provide the same buffer to portfolios that it did over the last year. We prefer to overweight cash at the expense of equities in the near-term and will wait for either lower prices, a more stable environment or both.
EQUITY MARKET
Figure 3: Equity Index ETF Returns
| ETF | Description | Q3 2019 Total Return | YTD Total Return |
| SPY | S&P 500 | 1.8% | 18.3% |
| QQQ | Nasdaq 100 | 1.3% | 21.5% |
| IWM | Russell 2000 | (2.3%) | 16.9% |
| IVW | S&P 500 Growth | 0.8% | 19.9% |
| IVE | S&P 500 Value | 2.8% | 16.6% |
| VXUS | International Ex-US | (1.5%) | 13.4% |
| IEMG | Emerging Markets | (4.7%) | 10.2% |
After a very strong first six months of the year, equity performance was somewhat mixed in the 3rd quarter. U.S. Equities performed well with SPY (S&P 500 ETF) and QQQ (Nasdaq 100 ETF) posting total returns of 1.8% and 1.3%, respectively. Small capitalization stocks were a notable area of underperformance with IWM (Russell 2000 ETF) lower by (-2.3%).
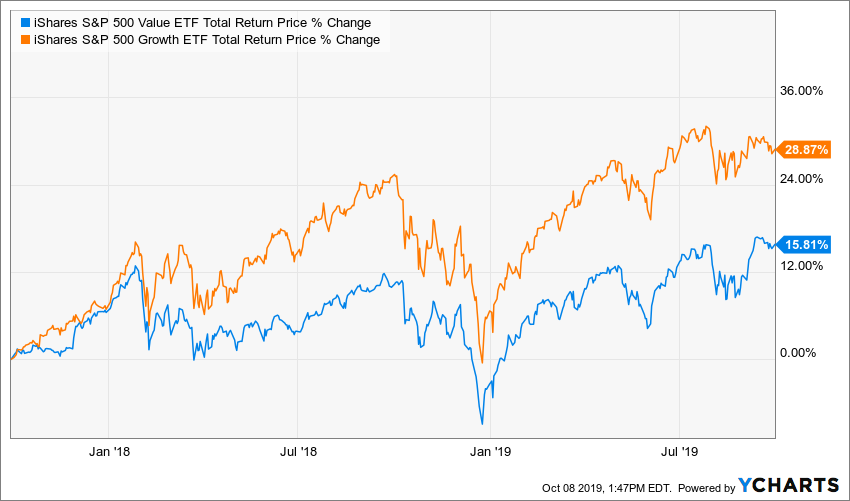
In a change of pace, IVE (S&P 500 Value ETF) outperformed IVW (S&P 500 Growth ETF) by 2.0%, as investors bid up defensive sectors that are less economically sensitive. That being said, IVW has produced nearly twice the return of IVE over the last two years, so it is a little early to call this a change in trend.
Figure 4: 2-Year Total Return of IVE and IVW
International equities did not fare as well as domestic equities during the 3rd quarter, with VXUS (International ETF) and IEMG (Emerging Market ETF) down (-1.5%) and (-4.7%), respectively. This was a result of slowing growth and the resurgence of trade related concerns.
Much like 2016, there is a sense that equities are fully valued and the economy is due for a meaningful slowdown, or even a recession. Furthermore, we are heading into a Presidential election year, so it is unlikely that any major stimulative policy action will be put into action. We continue to be underweight equities and have increased our cash position over the quarter. Our positioning in defensive sectors paid off handsomely in the second quarter, but rather than add to these positions, we prefer to hold a little more cash given their recent run up.
Figure 5: Equity Sector Returns
| ETF | Description | Q3 2019 Total Return | YTD Total Return | |
| XLU | Utilities | 9.4% | 14.4% | |
| XLP | Consumer Staples | 6.4% | 15.9% | |
| XLK | Technology | 3.5% | 26.8% | |
| XLF | Financials | 2.0% | 17.1% | |
| XLY | Consumer Disc | 1.6% | 21.2% | |
| XLI | Industrials | 0.8% | 21.4% | |
| XLB | Materials | (0.0%) | 17.0% | |
| IYZ | Telecom | (0.4%) | 13.1% | |
| XLV | Healthcare | (2.3%) | 7.9% | |
| XLE | Energy | (6.2%) | 13.0% |
XLU (Utilities ETF) and XLP (Consumer Staples ETF) were by far the top performing sectors with total returns of 9.4% and 6.4%, respectively. These defensive sectors handily beat SPY’s (S&P 500 ETF) 1.8% return, as investor’s searched for havens given the pick-up in volatility and increasing concerns over the strength of the economy.
XLE (Energy ETF) and XLV (Healthcare ETF) were the worst two performing sectors with losses of (-6.2%) and (-2.3%), respectively. XLE was temporarily higher after the price of crude oil spiked due to the attack on a Saudi Arabian oil facility. Most of those gains were reversed by the end of the quarter.
We were rewarded for some of our moves over the past 6 months, as we moved away from economically sensitive sector ETFs, such as XLF and XLE, and increased holdings of defensive sector ETFs, such as XLU and XLP.
Looking forward, it will be more difficult for these defensive sectors to rally meaningfully, but they will likely outperform in a bad market. It is for this reason that we have a preference for holding more cash, rather than adding to these defensive holdings.
Figure 6: Equity Sector Quarterly Total Return
FIXED INCOME MARKET
Figure 7: Fixed Income Returns
| ETF | Description | Q3 2019 Total Return | 2019 Total Return | |
| AGG | Aggregate Bond | 2.3% | 5.8% | |
| BND | Total Bond Market | 2.3% | 6.1% | |
| LQD | IG Corporate | 3.4% | 11.9% | |
| JNK | HY Corporate | 1.2% | 10.7% | |
| EMB | $ EM Bonds | 1.2% | 11.3% | |
| SHY | 1-3 Yr Treasuries | 0.6% | 2.4% | |
| IEF | 7-10 Yr Treasuries | 2.8% | 6.6% | |
| TLT | 20+ Yr Treasuries | 8.4% | 10.5% | |
| TIP | TIPs | 1.5% | 6.1% |
In the 3rd quarter, fixed income added to what were already impressive returns over the first six months of the year. Concerns over a slowing global and domestic economy caused long-term sovereign bond yields to plummet. The Federal Reserve and their global counterparties have shifted away from their hawkish rhetoric of 2018 and instead began lowering short-term rates and are considering further asset purchases.
With yields dropping, all areas of the bond market performed well, particularly longer duration holdings. It should be noted that higher credit quality outperformed lower credit quality. LQD (IG Corporate Bond ETF) returned 3.4% over the quarter, while JNK (High Yield Corporate Bond ETF) only returned 1.2%. The top performer was TLT (U.S. 20+ year Treasury Bond ETF) with a quarterly total return of 8.4%. That should not be a surprise given the winning combination of long duration and high credit quality.
Looking forward it is unlikely that fixed income will deliver the spectacular gains that we have enjoyed over the last 12 months in a normal market environment, but it remains an important allocation for any diversified portfolio. High quality, fixed income will be one of the few havens of positive performance if the economy experiences a deflationary environment. While a 10-year yield of 1.68% doesn’t sound very attractive, compare that to the (-0.6%) yield on the 10-year German bund!
Given today’s low yields, we prefer to hold additional cash versus adding to fixed income holdings at these yield levels.
Figure 8: U.S. Treasury Yields
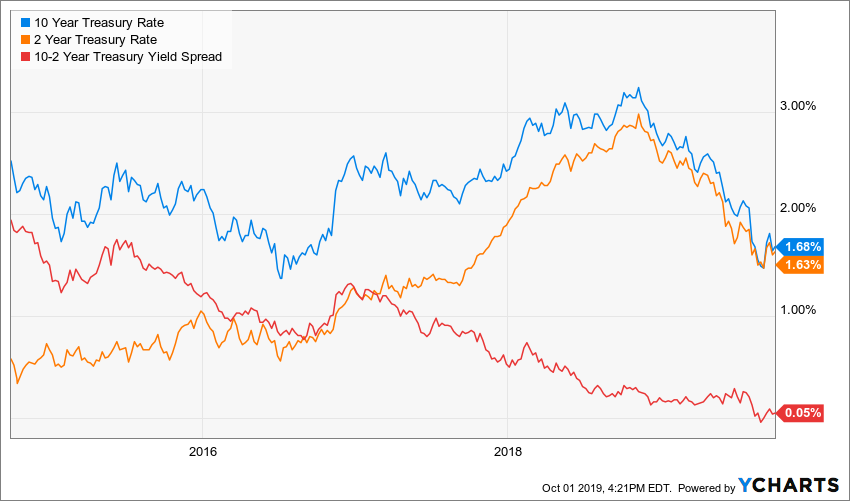
Bond yields continued to fall in the 3rd quarter as economic data reinforced the narrative that the economy was slowing and concerns around trade negotiations between the U.S. and China broke down once again. After briefly going below zero, the spread between the yield of the 10-year and 2-year U.S. treasury bond ended the quarter at +5 bps.
While investors commonly monitor this indicator for signs of a coming recession, it also has real life implications as a narrow spread makes it more difficult for banks to earn income from their loan portfolio. This also makes new lending less attractive, which further dampens economic activity. The Federal Reserve would like to see this spread grow, so expect them to continue to decrease short-term rates and provide stimulus to the economy.
Figure 9: U.S. Corporate Credit Spreads
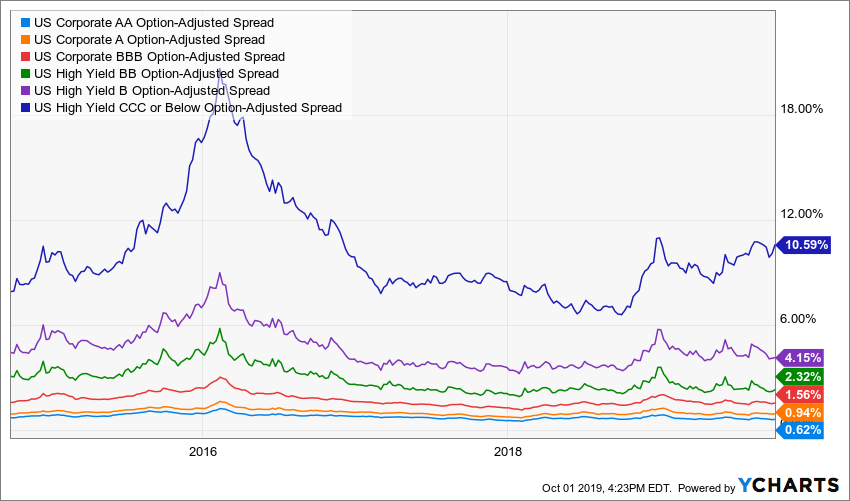
Corporate credit spread levels were generally stable relative to where they ended the 2nd quarter. The exception is CCC-rated debt, which experienced a +70 bps widening by the end of the 3rd quarter. The underperformance of the lowest credit bonds reflects investors’ growing angst over a potential recession and default cycle. B-rated or better bond spreads were relatively flat and have been supported by an accommodative Federal Reserve.
In addition to economic data, we are watching credit spreads closely. A reversion of CCC-rated bonds will likely be an early signal that easing by the Federal Reserve is translating through to stronger economic growth. Alternatively, continued widening will make us question what has been a very resilient equity market.
CONCLUSION
The 3rd quarter was a reminder that markets go down as well as up. Luckily, the corrections were only of the 5% magnitude and the S&P 500 closed the quarter less than (-2%) off of its all-time high. It is a good time to take stock of your financial circumstances and make sure that your portfolio is aligned with your needs and risk tolerance. If something in your situation has changed or the recent movements in the market have made you uncomfortable, reach out to your financial advisor and let us know.
While the Federal Reserve has assuaged the market’s concerns for now, we still believe a slightly defensive posture is warranted. We have trimmed excess risk from the portfolio and raised cash balances. Despite our defensive posture, we are closely watching for signs that the economy is picking up from lower interest rates and we will make adjustments, if appropriate.
Our focus is long-term value creation for our clients and creating investment portfolios that will perform within their risk appetite. The market will not always go up, but it is important to keep your eyes fixed on the horizon and ride out the short-term gyrations. We thank you for entrusting us with the responsibility of managing your portfolio and being a client of Mountain Vista.
Disclaimer
The views and opinions expressed are for informational and educational purposes only as of the date of writing and may change at any time based on market or other conditions and may not come to pass. This material is not intended to be relied upon as investment advice or recommendations, does not constitute a solicitation to buy or sell securities and should not be considered specific legal, investment or tax advice. The information provided does not take into account the specific objectives, financial situation, or particular needs of any specific person. All investments carry a certain degree of risk and there is no assurance that an investment will provide positive performance over any period of time. Equity investments are subject to market risk or the risk that stocks will decline in response to such factors as adverse company news or industry developments or a general economic decline. Debt or fixed income securities are subject to market risk, credit risk, interest rate risk, call risk, tax risk, political and economic risk, and income risk. As interest rates rise, bond prices fall. Non-investment-grade bonds involve heightened credit risk, liquidity risk, and potential for default. Foreign investing involves additional risks, including currency fluctuation, political and economic instability, lack of liquidity and differing legal and accounting standards. These risks are magnified in emerging markets. Past performance is no guarantee of future results.
