
INTRODUCTION
“Building wealth is a marathon, not a sprint. Discipline is the key ingredient”
-Dave Ramsey
Equity market returns over the last decade have been remarkable and were well above long-term averages. Since its introduction in 1927, the S&P Composite/S&P 500 have compounded between 10-11% annually. Over the last 10 years, the index has returned 17%. These outsized returns have outpaced earnings growth, pushing the forward price/earnings ratio of the S&P 500 north of 20x, a level not seen since the Dotcom boom in the early 2000s.
High valuations do not necessarily mean the market is going to crash. There are logical reasons for higher valuations, such as low interest rates, greater concentration of capital light tech businesses, no/low transaction costs and accessibility of data. That being said the margin for error has been reduced greatly.
Given today’s expensive valuations, it is logical to expect lower returns in the future, but market forecasters have been expecting lower returns for a number of years. Also, with 10-year treasury yields around 1.5% and historically high inflation, there are not many good investment alternatives.
What should you do? Stay invested in a balanced portfolio and avoid the temptation to make large changes to your asset allocation. Equities, while expensive, are the best bet for earning positive real returns. Utilize fixed income and cash to stabilize the portfolio and provide dry powder for opportunistic purchases should equities reprice to historical norms. Alternatives, such as real estate, private equity and venture capital may also be attractive for some investors with ample liquidity.
We deeply appreciate your confidence and will continue to work tirelessly to improve your financial future. Stay safe and stay invested!
Sincerely,

Jonathan R. Heagle, CFP®, CFA
President and Chief Investment Officer
OVERALL MARKET COMMENTARY
The Delta variant had a material impact on the markets over the course of the 3rd quarter. While the vaccines proved effective at limiting the severity of an infection and the risk of mortality, the escalation of cases and reimposition of mask mandates had a negative impact on consumer behavior and economic growth.
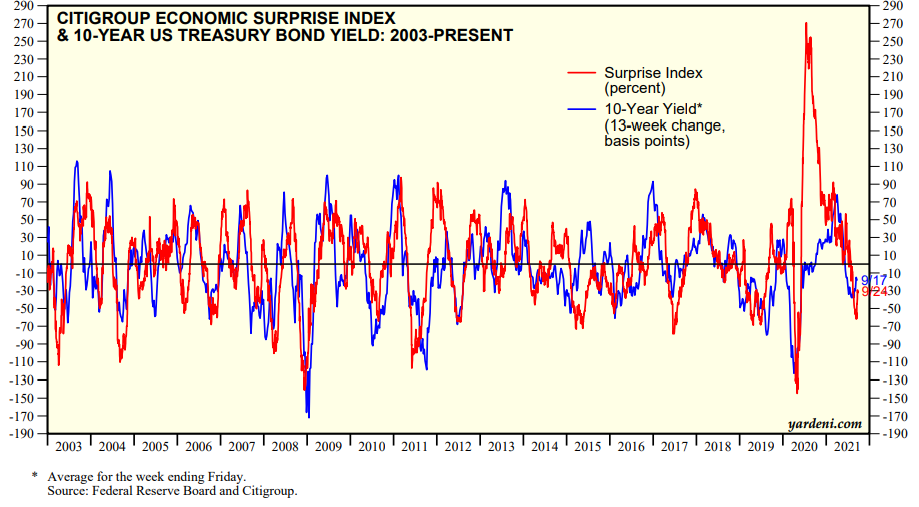
Economic data cooled down, causing the Citi Economic Surprise Index to go negative and pushing the 10-year treasury yield to a low of 1.19% in August. Cyclicals were under pressure, while Tech, Healthcare and Utilities led the market.
As you can see in Figure 1, we ended the quarter on a more positive note, with both yields and economic activity rebounding. Should this continue, we may see a repeat of the cyclical outperformance experienced from November 2020 to May 2021.
Figure 1: Citi Economic Surprise Index and 10-Year Treasury Yield (13-week change)
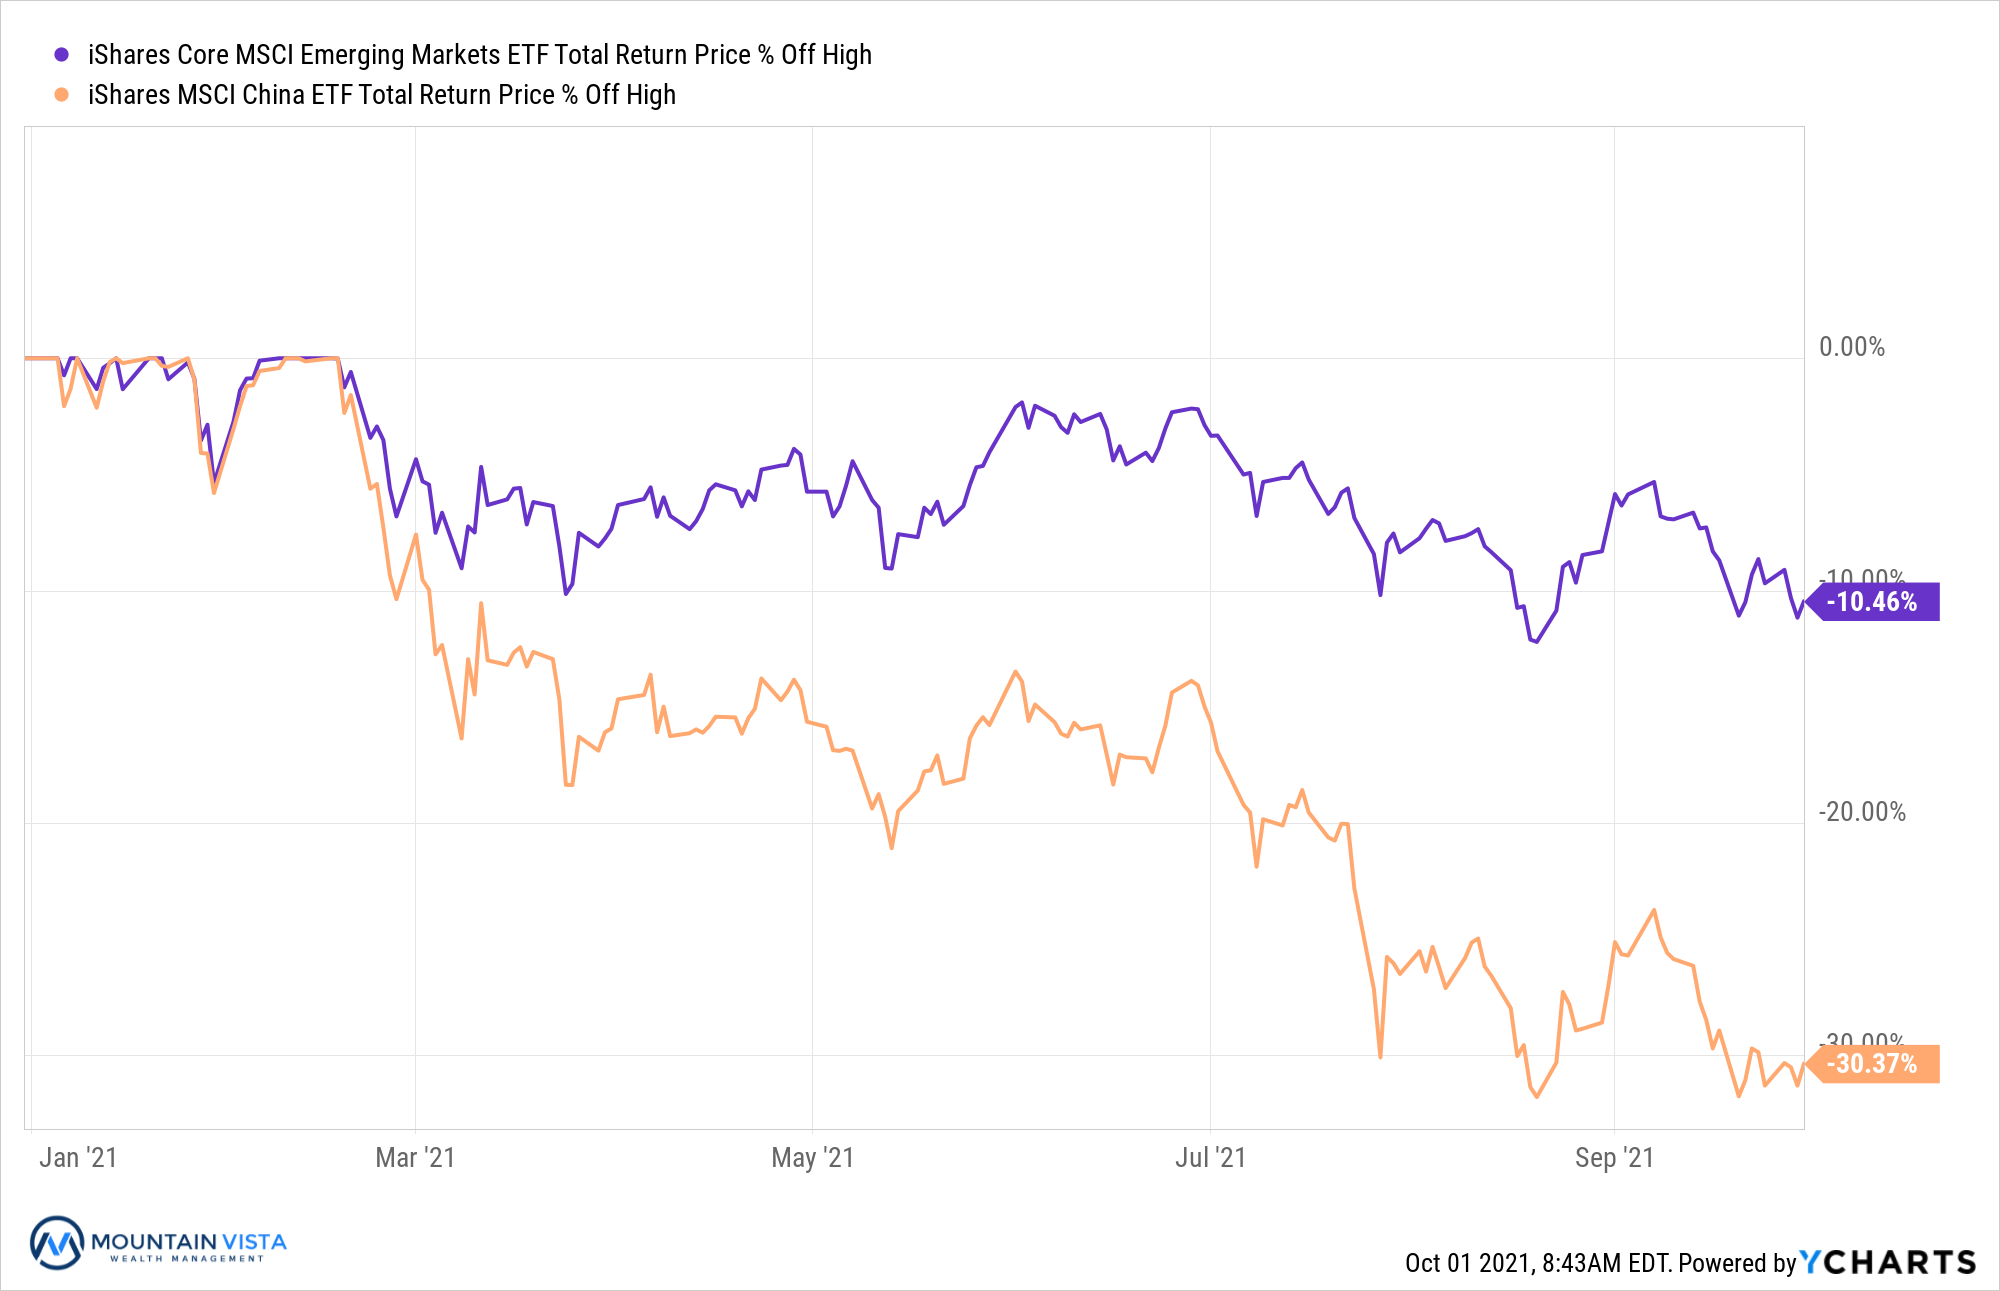
It was a modestly positive quarter for U.S. Large Capitalization equities, with the S&P 500 returning 0.6%. Emerging Market stocks did not fare as well, with IEMG (Emerging Market ETF) losing (-7.8%). The ETF was dragged lower by its exposure to Chinese companies. After peaking in February, MCHI (MSCI China ETF) has fallen (-30.4%) in response to the various moves that the Chinese Communist Party has taken against various domestic companies and industries.
Figure 2: IEMG and MCHI 2021 Drawdown
Federal Reserve Taper Talk and Other Drama
The market has been anxiously waiting for the Federal Reserve to provide more details about when and how quickly they will be ending their bond purchasing program, or quantitative easing. They are currently purchasing $120 billion of Treasuries and mortgage bonds each month, in order to stabilize and the economy and financial markets. With the economy on much stronger footing and growing concerns over inflation, the pressure on the Federal Reserve to end its purchase program has been growing for some time.
The statement released following September’s Federal Open Market Committee meeting (FOMC) noted that tapering “may soon be warranted”. During the press conference, Fed-chair Powell did not provide clarity on the exact month, but many economists believe that the tapering of purchases will begin in November or December of this year. Powell did say that most committee members believed that the purchases would end sometime in mid-2022.
Fed-chair Powell made a point of decoupling tapering from rate increases, so the Fed Funds rate will remain near zero for the foreseeable future. Half of the FOMC members expect at least one rate increase in 2022 and all but one expects at least one rate hike by the end of 2023.
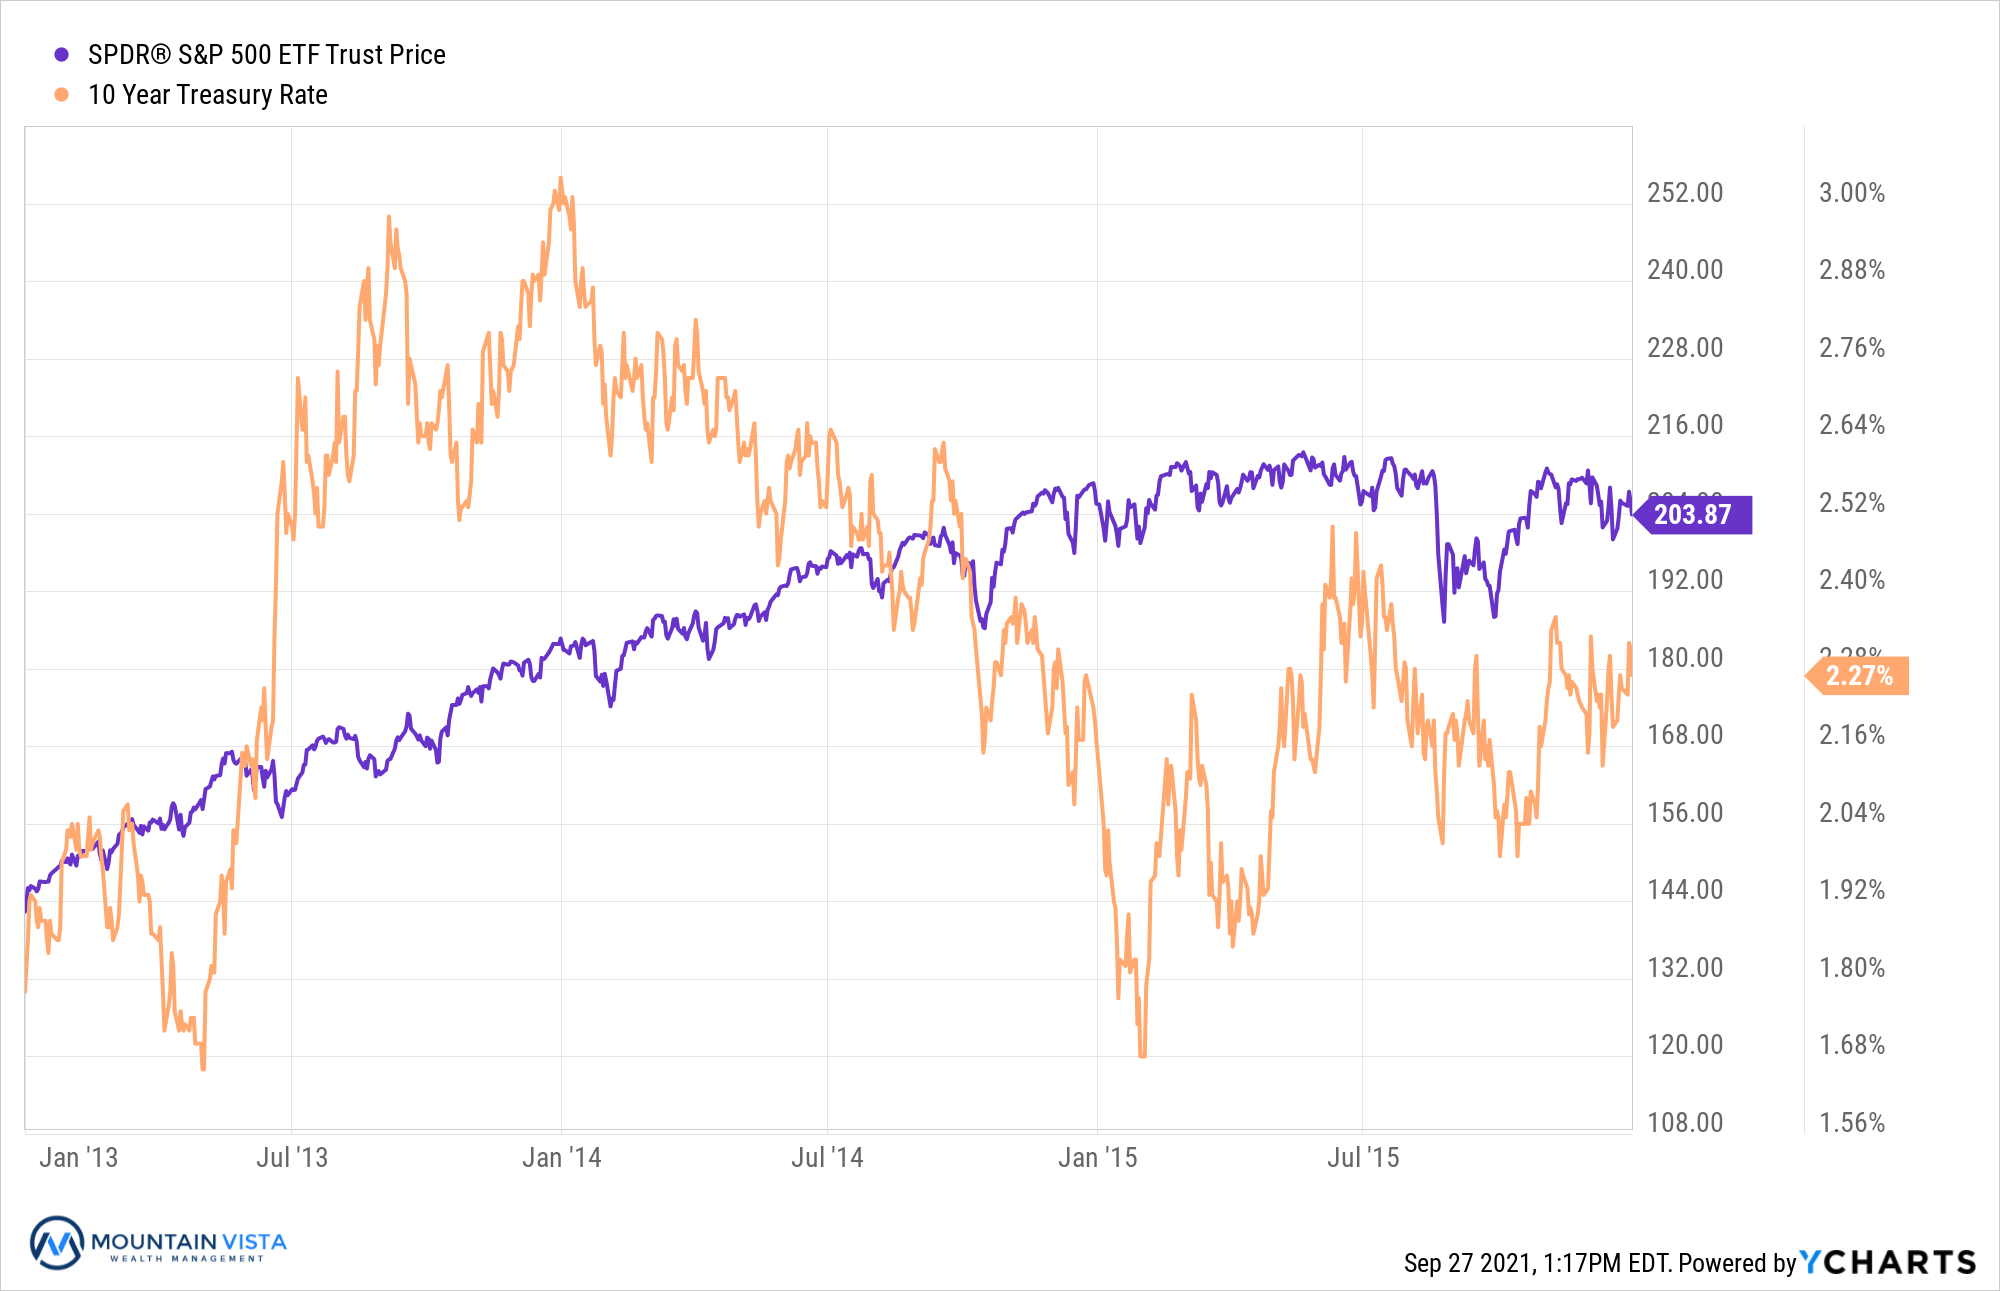
While much is being made of the taper and its risk to the market. The famed “taper tantrum” from 2013 was more of an event for the bond market than equities. As you can see in Figure 2, the S&P 500 barely budged in 2013 and proceeded to march higher for 2 more years.
Figure 3: S&P 500 ETF and 10-Year Treasury Yield from 2013-2015
While this time may be different, if the Federal Reserve is tapering purchases and raising rates, it is likely because the economy is growing. At the end of the day, fundamentals do matter.
Shortly after the FOMC meeting, two Fed Governors, Eric Rosengren (Boston) and Robert Kaplan (Dallas), resigned in response to concerns about personal trading activity that took place during 2020. While the actions may not have been directly in conflict with the Fed’s rules governing personal investments, they raise concerns around the obvious conflict of interest as it relates to their role and decisions as Fed Governors.
This behavior reflects poorly on the leadership and oversight responsibilities of Chair Powell, whose re-nomination was already coming under question by the Senator Elizabeth Warren and other progressive Democrats who would like to see a Biden appointed Fed Chair. This drama strengthens their case and substantially decreases the odds of a re-appointment.
What does this mean for the markets? For one, more uncertainty about future Federal Reserve policy. While there is a good chance that any replacement candidates would have a dovish tilt, looking to keep the economy strong into the mid-term elections, there is no guarantee. This uncertainty has us less willing to aggressively buy this pullback in the market and maintain a neutral weighting toward equities.
EQUITY MARKET
Figure 4: Equity Index ETF Returns
| ETF | Description | Q3 2021 Total Return | 2021 YTD Total Return |
| SPY | S&P 500 | 0.6% | 15.9% |
| QQQ | Nasdaq 100 | 1.1% | 14.5% |
| IWM | Russell 2000 | (4.3%) | 12.3% |
| IVW | S&P 500 Growth | 1.8% | 16.3% |
| IVE | S&P 500 Value | (0.9%) | 15.2% |
| VXUS | International Ex-US | (3.2%) | 6.8% |
| IEMG | Emerging Markets | (7.8%) | 0.3% |
The 3rd quarter started out strong for U.S. equity indices, with both SPY (S&P 500 ETF) and QQQ (Nasdaq 100 ETF) peaking in early September with year-to-date returns of 22%. As is often the case, September was a difficult month for equities. SPY and QQQ ended the month down (-5.3%) and (-6.3%), respectively, from their early September highs. Their quarterly returns totaled 0.6% and 1.1%, respectively.
Small capitalization stocks continued to struggle, relative to large capitalization stocks, after their very strong 1st quarter. IWM (Russell 2000 ETF) lost (-4.3%) in Q3 2021, but remains positive year-to-date with a 12.3% return. Small cap stocks performance will be very correlated with the strength of growth in the post-pandemic economy.
Growth stocks outperformed Value stocks by 2.7%, but the gap narrowed from a peak of over 6.9% intra-quarter. IVE (S&P 500 Value ETF) and IVW (S&P 500 Growth ETF) generated quarterly returns of (-0.9%) and 1.8%, respectively. With interest rates poised to move higher and concerns about inflation lingering, it is possible that we see another period of outperformance from value.
International equities and emerging markets equities underperformed U.S. equities, once again. In the 3rd quarter, VXUS (International ETF) and IEMG (Emerging Market ETF) declined (-3.2%) and (-7.8%), respectively. The primary source of the poor performance was the decline in Chinese equities, following aggressive actions taken by President Xi Jinping and the CCP to crack down on various domestic industries.
We maintain a neutral weight towards equities, given the strong economic backdrop and historically low bond yields. While equities are currently experiencing a bout of volatility and technical damage has been done, we believe the Federal Reserve will continue to be cautious in its removal of accommodation and that the economy is still in recovery.
Figure 5: Equity Sector Returns
| ETF | Description | Q3 2021 Total Return | 2021 YTD Total Return |
| XLF | Financials | 2.7% | 28.9% |
| XLU | Utilities | 1.8% | 4.2% |
| XLV | Healthcare | 1.4% | 13.4% |
| XLK | Technology | 1.3% | 15.5% |
| XLRE | Real Estate | 0.8% | 24.3% |
| XLY | Consumer Disc | 0.7% | 12.1% |
| XLC | Communications | (0.9%) | 19.3% |
| XLP | Consumer Staples | (1.0%) | 3.9% |
| IYZ | Telecom | (1.5%) | 9.8% |
| XLE | Energy | (2.1%) | 42.0% |
| XLB | Materials | (3.5%) | 10.7% |
| XLI | Industrials | (4.1%) | 11.5% |
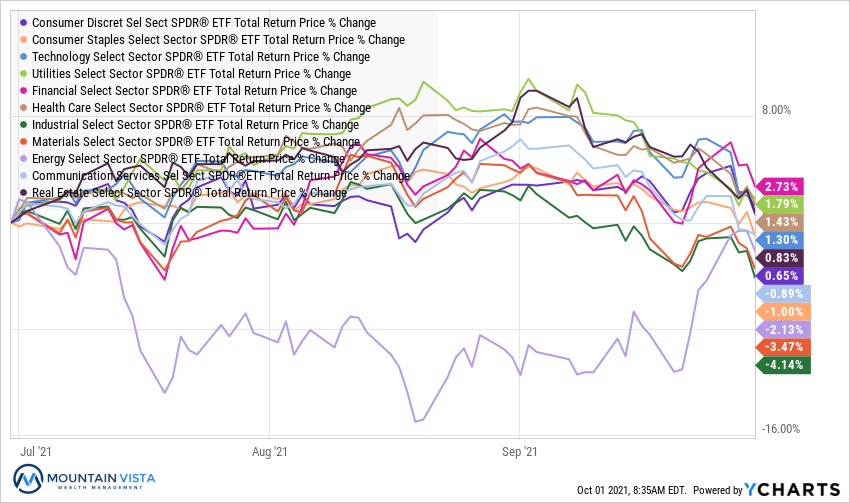
In the 3rd quarter, leadership was inconsistent and there was no clear theme. XLV (Healthcare Sector ETF) and XLU (Utilities Sector ETF), two defensive sectors, were in the top 3, but XLF (Financials Sector ETF), a cyclical sector, took the top spot.
XLF (Financial Sector ETF) returned 2.7% in the 3rd quarter, benefiting from the rebound in interest rates during September. XLU (Utilities Sector ETF) and XLV (Healthcare Sector ETF) rounded out the top 3 with quarterly gains of 1.8% and 1.4%, respectively. XLI (industrials Sector ETF) and XLB (Materials Sector ETF) were the worst performing sectors with negative returns of (-4.1%) and (-3.5%), respectively.
During the quarter, we removed our overweight in XLRE (Real Estate Sector ETF) and XLK (Technology Sector ETF) and initiated overweight positions in XLP (Consumer Staples ETF). We are also overweight XLF (Financial Sector ETF) and XLC (Communications Sector ETF).
Figure 6: Equity Sector Quarterly Total Return
FIXED INCOME MARKET
Figure 7: Fixed Income Returns
| ETF | Description | Q3 2021 Total Return | 2021 YTD Total Return |
| AGG | Aggregate Bond | (0.0%) | (1.7%) |
| BND | Total Bond Market | (0.0%) | (1.8%) |
| LQD | IG Corporate | (0.5%) | (2.2%) |
| JNK | HY Corporate | 0.5% | 3.3% |
| EMB | $ EM Bonds | (1.2%) | (2.6%) |
| SHY | 1-3 Yr Treasuries | 0.0% | (0.1%) |
| IEF | 7-10 Yr Treasuries | (0.0%) | (3.4%) |
| TLT | 20+ Yr Treasuries | 0.4% | (7.5%) |
| TIP | TIPs | 1.7% | 3.2% |
Entering the 3rd quarter, long-term bond yields were falling. The yield on the 10-year U.S. Treasury started the quarter at 1.45% and fell to low of 1.19% in July and August. From early August through the end of the quarter the 10-year U.S. Treasury yield increased 33 bps to 1.52%.
TIP (U.S. Treasury Inflation Protected ETF) returned 1.7% in the quarter, followed by JNK (High Yield Corp ETF) with a 0.5% return.
EMB (Emerging Market Dollar Bond ETF) declined (-1.2%) in the quarter. Emerging Market bonds came under pressure after the Federal Reserve meeting, which also kicked off dollar strength.
We remain underweight fixed income, in favor of cash. We are waiting for a 2% yield on the 10-year U.S. Treasury to return to a neutral weight. We are monitoring the economy closely and will adjust our view and entry price, if necessary.
Figure 8: U.S. Treasury Yields
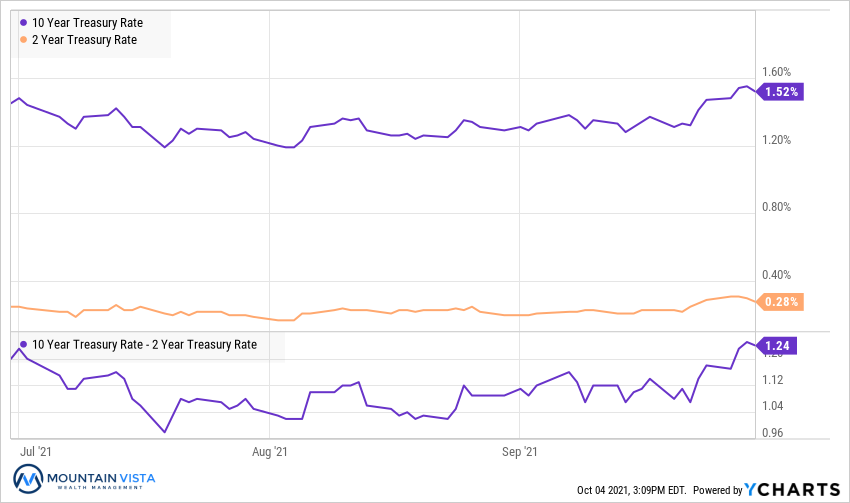
The U.S. Treasury curve continued to flatted in July, but ultimately closed the 3rd quarter modestly steeper. 10-year U.S. Treasury yields increased by 7 bps to 1.52%, while the 2-year U.S. Treasury yield increased by 3 bps to 0.28%. This resulted in a 4 bps increase in the spread between 2’s and 10’s.
We will be watching the steepness of the curve as the Fed starts tapering its purchases. First level thinking suggests that yields should move higher as they buy less, but experience has shown that expectations of lower growth and inflation have caused long-term yields to fall. Time will tell if this pattern repeats itself.
Figure 9: U.S. Corporate Credit Spreads
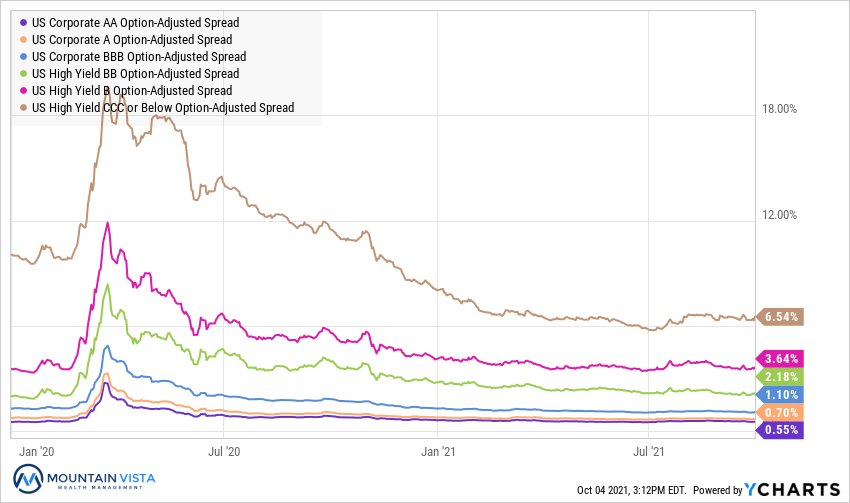
Corporate credit spreads increased over the course of the 3rd quarter, but are still very low on a historic basis. At this point, we believe the increases are more reflective of unusually tight levels in June, rather than an indication of something more nefarious.
CCC-rated bond spreads widened by 79 bps over the 3rd quarter, while AA-rated bonds widened by only 3 bps. Most of the damage was contained to CCC-rated and B-rated bonds.
The credit markets are performing well, in the context of the recent equity volatility. Should this stop being the case, we would be more concerned about the potential depth of the correction in equities.
CONCLUSION
We ended the 3rd quarter with the S&P 500 in a 5% drawdown from the highs. As we mentioned in the 2nd quarter commentary, corrections are the price that you pay to earn the attractive long-term returns of the stock market. According to Yardini Research, since 1950, the market has experienced a correction, defined as a drop of at least 10%, every 1.87 years. Resist the urge to sell long-term investments during these times.
While there is no guarantee that the prices will not fall further before recovering. I take solace in the fact that we have a strong economy and an accommodative Federal Reserve. Yes, the Fed will be reducing their bond buying, but they are still buying and keeping interest rates low for the foreseeable future.
We are coming out of a seasonally weak period. August to October is a period notorious for poor equity returns. The market has also been dealing with a lot of issues: Distress in a major Chinese real estate developer, congressional discord around the infrastructure deal and debt ceiling, supply chain disruptions, high inflation expectations, changes in Federal Reserve policy and unexpected changes to the make-up of the FOMC members.
Whew! That is a long list. As these items get resolved, the market will once again focus on fundamentals and prices should recover. Be patient and stay with your long-term plan.
Thank you to our clients for your continued support of Mountain Vista. I look forward to helping you navigate the final quarter of 2021.
Sincerely,
Jonathan R. Heagle, CFP®, CFA
President and CIO
Disclaimer
The views and opinions expressed are for informational and educational purposes only as of the date of writing and may change at any time based on market or other conditions and may not come to pass. This material is not intended to be relied upon as investment advice or recommendations, does not constitute a solicitation to buy or sell securities and should not be considered specific legal, investment or tax advice. The information provided does not take into account the specific objectives, financial situation, or particular needs of any specific person. All investments carry a certain degree of risk and there is no assurance that an investment will provide positive performance over any period of time. Equity investments are subject to market risk or the risk that stocks will decline in response to such factors as adverse company news or industry developments or a general economic decline. Debt or fixed income securities are subject to market risk, credit risk, interest rate risk, call risk, tax risk, political and economic risk, and income risk. As interest rates rise, bond prices fall. Non-investment-grade bonds involve heightened credit risk, liquidity risk, and potential for default. Foreign investing involves additional risks, including currency fluctuation, political and economic instability, lack of liquidity and differing legal and accounting standards. These risks are magnified in emerging markets. Past performance is no guarantee of future results.