
INTRODUCTION
“Most of the returns in stocks are concentrated in sharp bursts beginning in periods of great pessimism or fear… We believe time, not timing, is key to building wealth in the stock market.” -Bill Miller
This quarter was certainly a roller coaster ride for the stock market. The S&P 500 climbed 14% through mid-August, before reversing course, eliminating all of those gains and then some. This kind of volatility is enough to make even the strongest of stomachs a bit queasy. That said, the experience of the last three months should be a reminder of a few valuable lessons.
- Do not get caught up in the FOMO highs and depressed lows of the market. Chasing a rally or liquidating at the bottom is a guaranteed strategy for horrendous performance. Have a long-term plan and stick to it. This encourages prudent behavior during market extremes.
- Lengthen your time horizon. While the direction of the stock market is a coinflip on a daily basis, according to TD Ameritrade, from 1926 to 2020, the stock market produced positive one-year returns 74% of the time. Over a 5-year period, the probability increased to 87%. The stock market was never lower over a 15-year period.
- The media’s job is to attract attention, not to provide investment advice. When the market is lower/higher, expect to hear from commentators with negative/positive views. Do not allow this bias to impact your behaviors.
- This is a different market environment. Since the Global Financial Crisis, investors became accustomed to quick market recoveries, fueled by an accommodative Federal Reserve. With the Fed focused on controlling inflation, supporting the market is not their priority. Furthermore, lower equity prices may actually help them achieve their inflation mandate.
- Cash is king. Having some cash in your investment portfolio can give you runway should you need to access funds during market downturns. It also provides stability against market volatility and provides the opportunity to buy opportunistically when the market falls.
During challenging markets, such as the one we find ourselves in today, we are acutely focused on preserving your capital. While bear markets sow the seeds of the future bull market, an investor needs to stay invested with adequate capital to realize those future gains. We appreciate the trust you have placed in our team and our process.
Sincerely,
Jonathan R. Heagle, CFP®, CFA
President and Chief Investment Officer
OVERALL MARKET COMMENTARY
The 3rd quarter’s market action was dictated by two major themes; 1) stickier inflation and 2) a Federal Reserve that is singularly focused on bringing inflation back down.
After a promising CPI release in mid-July, the financial markets were largely positioned for slowing inflation, a “soft-landing” in the economy and a Federal Reserve that may take its foot off of the financial brakes. In late July, the market was pricing that the Fed Funds Rate would top out at ~3.25% and then go lower over the 2nd half of 2023. While this seems ludicrous now, the view was largely based upon a communication error from Chair Powell at their June conference, during which he suggested that rates were approaching neutral.
At the Federal Reserve’s annual conference in Jackson Hole in late August, Chairman Powell took the opportunity to correct his prior communication error, giving an incredibly short and “hawkish” speech using words like “pain” and “layoffs”, signaling to the market that the Fed was not pausing or pivoting anytime soon. Rates/equities promptly reacted by repricing higher/lower to reflect this new reality. (“Hawkish” is a term used to describe actions taken to tighten monetary policy)
The bad news persisted with a disappointing CPI release in September and a continuation of hawkish language out of the Federal Reserve at their September meeting. During this meeting they released their summary of economic projections, which included a forecast of the Federal Funds Rate reaching ~4.6% in 2023 and an increase in the unemployment rate to 4.4%. The yield on the 2-year U.S. Treasury Bond reached a high of 4.36% and the S&P 500 hit a low of 3585, a drawdown of approximately (-25%) from the January peak.
As we close the quarter, sentiment and price action are extremely bearish and oversold. That does not mean that we cannot head lower, but absent more bad news, the market is due for a bounce. Bears are focused on declining earnings expectations to drive the next leg lower. With such high nominal growth in the economy, they may need to wait longer.
Inflation, inflation go away!
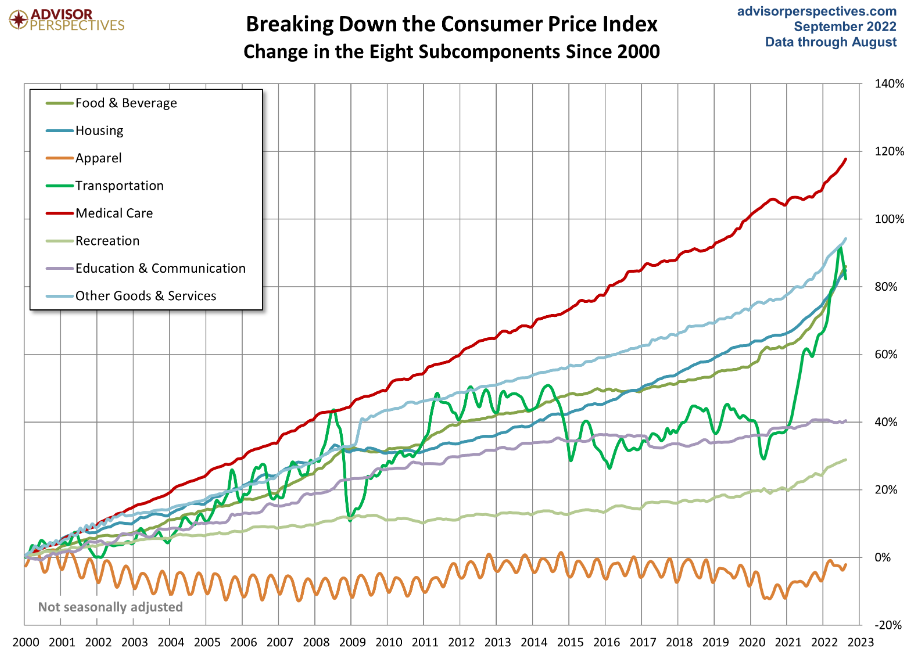
While there is evidence that inflation is cooling in many aspects of the economy, some of the stickier items, such as Housing, Insurance and Medical expenses, remain elevated and have actually accelerated over the prior few months. As you can see in Figure 1 below, the declines in Transportation, which include gas prices, were overwhelmed by continued strength in the stickier areas. Housing has an outsized effect on CPI, given its portion of a consumer’s monthly expenditures.
Figure 1: Consumer Price Index by Subcomponent
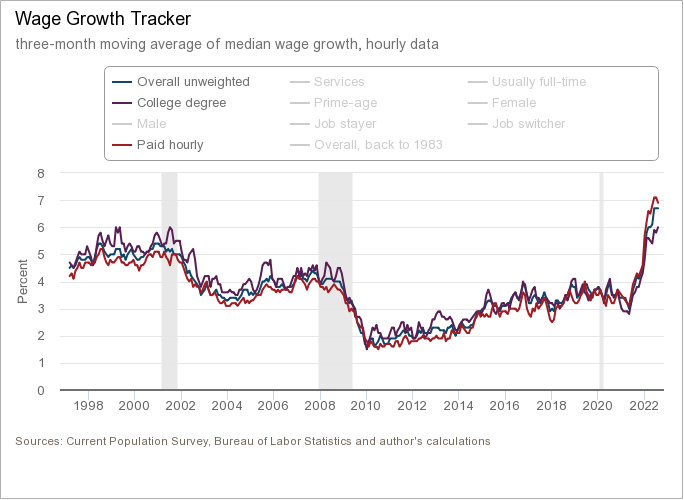
Wage growth also remains elevated, signaling that the employment market is too tight, and employees have the negotiating power. Economists fear a “wage-price spiral”, which occurs when workers continue demanding ever higher wages that drive prices even higher. This is why Chair Powell said that we need to see more layoffs. An odd request from an entity that is tasked with maintaining full employment.
Figure 2: 3-Month Moving Average Median Wage Growth
With the cooling of many commodities, substantial declines in shipping rates, tight financial conditions and a rapidly slowing housing market, it is only a matter of time that the Federal Reserve gets what it wants. Hopefully, it is through a garden-variety recession and not something more serious.
Why does this sell-off feel so bad?
Bear markets, defined as a drop of 20% from an all-time high, are always painful for investors. That being said the current bear market feels much worse than other recent bear markets, such as 2011, 2016, 2018 and even 2020. Looking at Figure 3 below, compiled by Bespoke Investment Group, it is clear why this bear has a bigger bite than any since the Global Financial Crisis.
Figure 3: Equity and Fixed Income Drawdowns (source Bespoke Investment Group)
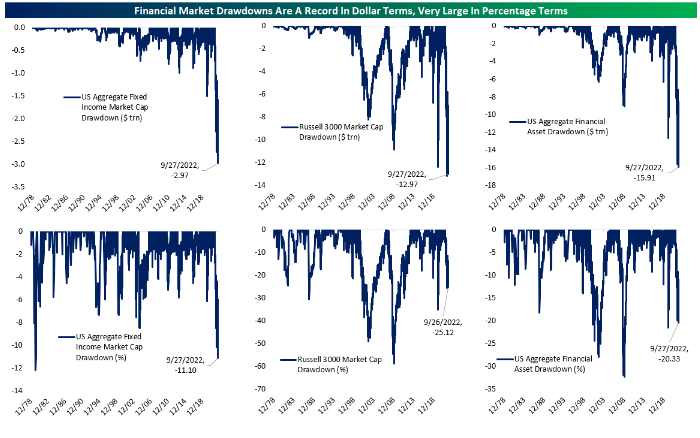
As you can see, we are not only experiencing a significant drawdown in equity prices, but U.S. fixed income markets are also experiencing their largest drawdown in percentage terms since the late 70s/early 80s, and the largest in dollar terms ever.
Equities are experiencing their largest ever decline in dollar terms, but on a percentage basis, the declines are far less extreme than other bear markets. What makes 2022 uniquely painful is that both fixed income and equities are falling at the same time.
EQUITY MARKET
Figure 4: Equity Index ETF Returns
| ETF | Description | Q3 2022 Total Return | Year-to-Date Total Return |
| SPY | S&P 500 | (4.9%) | (23.9%) |
| QQQ | Nasdaq 100 | (4.5%) | (32.5%) |
| IWM | Russell 2000 | (2.1%) | (25.1%) |
| IVW | S&P 500 Growth | (3.9%) | (30.5%) |
| IVE | S&P 500 Value | (5.9%) | (16.7%) |
| VXUS | International Ex-US | (10.8%) | (26.6%) |
| IEMG | Emerging Markets | (12.4%) | (27.4%) |
Equity markets continued to decline in the 3rd quarter of 2022. SPY (S&P 500 ETF) and QQQ (Nasdaq 100 ETF) returned (-4.9%) and (-4.5%), respectively, leaving them down (-23.9%) and (-32.5%) year-to-date. Intra-quarter volatility was much greater than the final tally suggest. In Mid-August, SPY and QQQ were actually up 14% and 19%, respectively.
Small capitalization stocks were also lower in the quarter, but modestly outperformed the large capitalization indices. IWM (Russell 2000 ETF) returned (-2.1%) in the 3rd quarter and is down (-25.1%) year-to-date.
Growth stocks surprisingly outperformed Value stocks, despite the risk-off environment. IVE (S&P 500 Value ETF) and IVW (S&P 500 Growth ETF) generated quarterly returns of (-5.9%) and (-3.9%), respectively, resulting in a 2% outperformance by Growth.
International and Emerging Markets both underperformed the S&P 500 meaningfully in the 3rd quarter. VXUS (International ETF) declined (-10.8%) and IEMG (Emerging Market ETF) fell (-12.4%). Dollar strength and higher bond yields were major drivers of the weakness.
A lot of bad news has been reflected in market pricing at current levels and we see the potential for a squeeze higher should there be a positive catalyst, or even a lack of more bad news. That being said, the Federal Reserve may be on the verge of a policy mistake, by moving too far too quickly. For this reason, we remain humble and flexible in our opinions.
Figure 5: Equity Sector Returns
| ETF | Description | Q3 2022 Total Return | Year-to-Date Total Return |
| XLY | Consumer Disc | 3.8% | (29.9%) |
| XLE | Energy | 1.8% | 33.9% |
| XLF | Financials | (3.0%) | (21.1%) |
| XLI | Industrials | (4.7%) | (20.7%) |
| XLV | Healthcare | (5.2%) | (13.1%) |
| XLU | Utilities | (6.0%) | (6.5%) |
| XLK | Technology | (6.3%) | (31.2%) |
| XLP | Consumer Staples | (6.9%) | (11.8%) |
| XLB | Materials | (7.1%) | (23.7%) |
| XLRE | Real Estate | (11.1%) | (28.9%) |
| XLC | Communications | (11.6%) | (37.9%) |
| IYZ | Telecom | (16.5%) | (35.6%) |
XLY (Consumer Discretionary Sector ETF) and XLE (Energy Sector ETF) were the top performing sectors in the 3rd quarter, returning 3.8% and 1.8%, respectively. XLE is the only sector with positive returns on a year-to-date basis.
IYZ (Telecom Sector ETF) and XLC (Communications Sector ETF) were the worst performing sectors in the 3rd quarter and on a year-to-date basis. Quarter-over-quarter, IYZ and XLC returned (-16.5%) and (-11.6%), respectively. Social media and streaming companies have faced difficulties as consumer activity shifts away from digital towards in-person in the post-pandemic environment.
We maintain our defensive posture with overweight positions in consumer staples and utilities. These sectors should continue to outperform should the economy continue to slow and potentially enter a recession.
Figure 6: Equity Sector Quarterly Total Return

FIXED INCOME MARKET
Figure 7: Fixed Income Returns
| ETF | Description | Q3 2022 Total Return | Year-to-Date Total Return |
| AGG | Aggregate Bond | (4.7%) | (14.4%) |
| BND | Total Bond Market | (4.6%) | (14.5%) |
| LQD | IG Corporate | (6.2%) | (21.2%) |
| JNK | HY Corporate | (1.7%) | (16.2%) |
| EMB | $ EM Bonds | (5.8%) | (24.9%) |
| SHY | 1-3 Yr Treasuries | (1.6%) | (4.5%) |
| IEF | 7-10 Yr Treasuries | (5.7%) | (15.6%) |
| TLT | 20+ Yr Treasuries | (10.3%) | (29.9%) |
| TIP | TIPs | (5.3%) | (13.9%) |
Fixed income continued to struggle in the 3rd quarter, as sticky inflation resulted in an increasingly hawkish Federal Reserve. Yields increased to reflect this new reality, with short-term yields increasing more than long-term yields. The muted response of long-term yields shows that the Federal Reserve has not lost credibility and longer-term inflation expectations remain relatively anchored.
SHY (1-3 Year US Treasury ETF) fared best in the increasing yield environment, losing only (-1.6%) in the 3rd quarter. Bonds lose value as yields increase and their sensitivity to yields goes up with the time to maturity. For this reason, it is logical that SHY outperformed other ETFs with longer term holdings.
TLT (20+ Year US Treasury ETF) fell (-10.3%) in the quarter and is down (-29.9%) year-to-date. TLT has the most rate sensitivity of the fixed income ETFs and was meaningfully impacted by increases in long-term yields. The extreme nature of this environment is evident when you consider that TLT is down nearly as much as the Nasdaq 100 year-to-date.
With the dramatic move higher in interest rates, we think that fixed income is currently attractive based upon its income and ability to hedge against a regime shift towards lower inflation and economic growth.
Figure 8: U.S. Treasury Yields
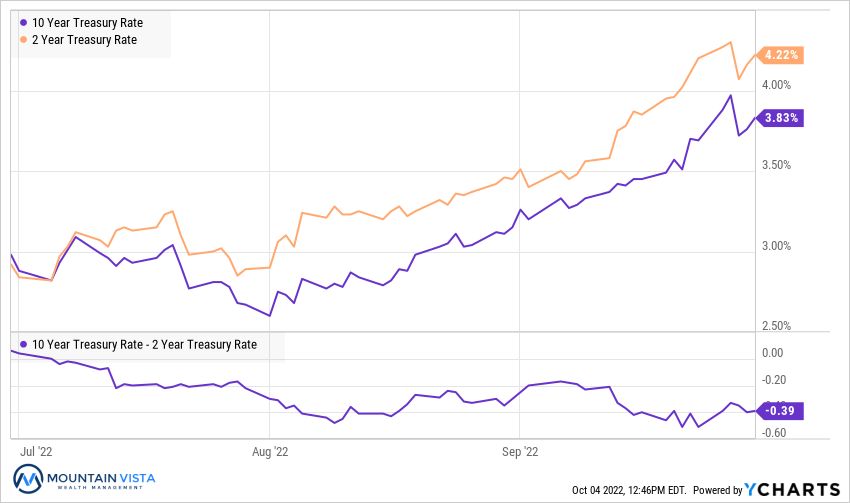
The U.S. Treasury curve inverted at most points in the curve over the course of the 3rd quarter. The Federal Reserve increased the Fed Funds rate to a range of 3-3.25% and is expected to exceed 4% by year-end. The 2-year/10-year spread ended the 3rd quarter at (-39 bps).
While the media tends to focus on the 2-year/10-year spread, it is actually the 3-month/10-year spread that has a perfect track record of predicting a recession. While the 3-month/10-year spread remains positive at 50 bps, this spread will likely go negative in the 4th quarter, should the Federal Reserve follow through on its plans to raise the Fed Funds rate over 4% by year-end.
Figure 9: U.S. Corporate Credit Spreads
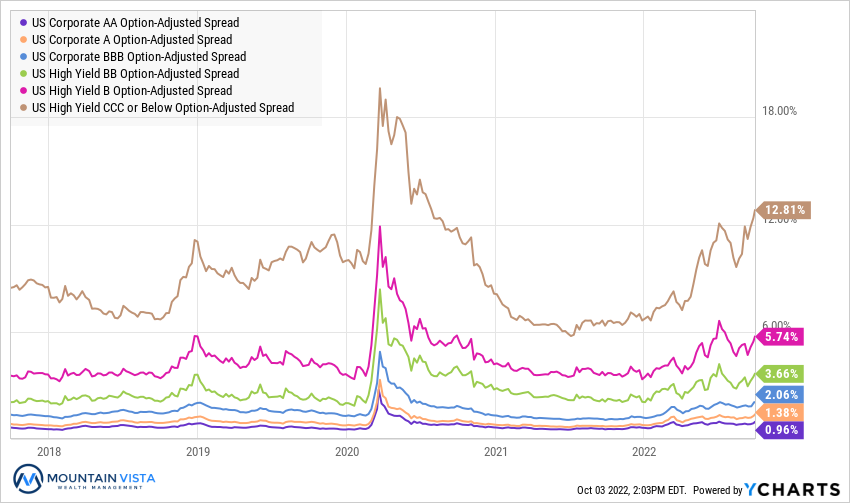
Corporate credit spreads were mixed in the 3rd quarter. After rallying early in July, spreads moved higher as equities came under renewed pressure during August and September.
CCC-rated bond spreads widened by 87 bps, while BB and B-rated bond spreads tightened by
(-51 bps) and (-78 bps), respectively. Higher rated bonds were largely stable quarter-over-quarter.
The further widening of CCC spreads suggests that the market is more concerned about a recession induced defaults, but the stability/tightening of higher rated bond spreads suggest that systemic risk is less of an issue.
CONCLUSION
Since the Global Financial Crisis, savers have been punished through lower rates and the Federal Reserve’s policy of “financial repression”. With bank accounts and safe fixed income paying near 0%, investors were forced to take more risk in via equities or riskier corners of fixed income. For retirees, this is clearly suboptimal.
Today the 2-year treasury rate is well over 4% and investment-grade bonds yield 5-6%. Investors once again have options to earn good returns without taking substantial risk. This is a very positive development that should celebrated by all investors, but especially retirees.
While the adjustment to these higher rates has been painful for the financial markets in the short-term, once the Federal Reserve brings inflation down (and they will), the prospect of forward returns of a balanced portfolio is much brighter than it was coming into 2022.
Our goal is to preserve investor capital during this transition, while ensuring that we can participate in the recovery on the other side.
Thank you to our clients for your continued support of Mountain Vista. We are dedicated to helping you navigate this uncertain time and are constantly looking for ways to improve the risk-reward profile of your investment portfolio.
Sincerely,
Jonathan R. Heagle, CFP®, CFA
President and Chief Investment Officer
Disclaimer
The views and opinions expressed are for informational and educational purposes only as of the date of writing and may change at any time based on market or other conditions and may not come to pass. This material is not intended to be relied upon as investment advice or recommendations, does not constitute a solicitation to buy or sell securities and should not be considered specific legal, investment or tax advice. The information provided does not take into account the specific objectives, financial situation, or particular needs of any specific person. All investments carry a certain degree of risk and there is no assurance that an investment will provide positive performance over any period of time. Equity investments are subject to market risk or the risk that stocks will decline in response to such factors as adverse company news or industry developments or a general economic decline. Debt or fixed income securities are subject to market risk, credit risk, interest rate risk, call risk, tax risk, political and economic risk, and income risk. As interest rates rise, bond prices fall. Non-investment-grade bonds involve heightened credit risk, liquidity risk, and potential for default. Foreign investing involves additional risks, including currency fluctuation, political and economic instability, lack of liquidity and differing legal and accounting standards. These risks are magnified in emerging markets. Past performance is no guarantee of future results.