
INTRODUCTION
“Far more money has been lost by investors trying to anticipate corrections, than lost in the corrections themselves.” – Peter Lynch
We spend a lot of time in our investment letters discussing the negative implications of overreacting to recent market trends, sensational news stories, or partisan politics. It does not mean that the story of the day does not matter, but that the market is forward looking and incredibly good at anticipating changing conditions. By the time a story becomes newsworthy, it is typically too late to make a change. Also, what seems critically important today can be quickly forgotten as a new narrative takes hold. Time usually heals all wounds!
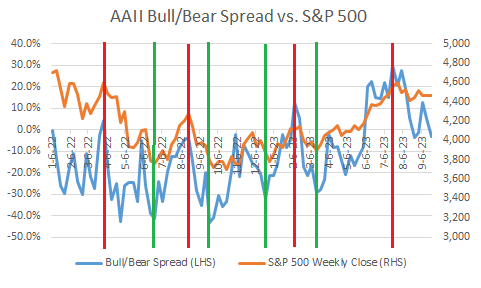
Take a look at investor sentiment, as indicated by the spread between Bulls and Bears published by the American Association of Individual Investors, relative to the S&P 500. As you can see below, extremes in sentiment are usually contrary indicators for the future direction of the S&P 500. The red lines indicate peaks in sentiment (more bulls relative to bears), while the green lines indicate bottoms in sentiment.
With all of these opportunities to make a bad decision, coupled with our instinctual fight or flight response, it becomes clear why investing for the long-term is the right decision for most people.
Sincerely,
Jonathan R. Heagle, CFP®, CFA
President and Chief Investment Officer
OVERALL MARKET COMMENTARY
After a very strong start to the year, equity markets gave back a good portion of their gains in August and September. Both the S&P 500 and Nasdaq 100 were down approximately (-3%) in the 3rd quarter, and (-6%) since the end of July. Small capitalization stocks fared even worse, down over (-5%) in the quarter and over (-10%) since the end of July. Despite the losses, the S&P 500 and Nasdaq 100 are still up 13% and 35%, respectively, year-to-date.
The bond market did not perform much better, with the yield on the 10-year U.S. Treasury bond jumping more than 75 bps and TLT (20+ year Treasury ETF) losing (-13%) in the 3rd quarter.
For most of the year, investors were focused on falling inflation and a resilient economy. The “not too hot, not too cold” environment allowed equities to melt higher, while bond yields remained under control, as investors anticipated a pause and eventual reversal of the Federal Reserve’s relentless rate increases.
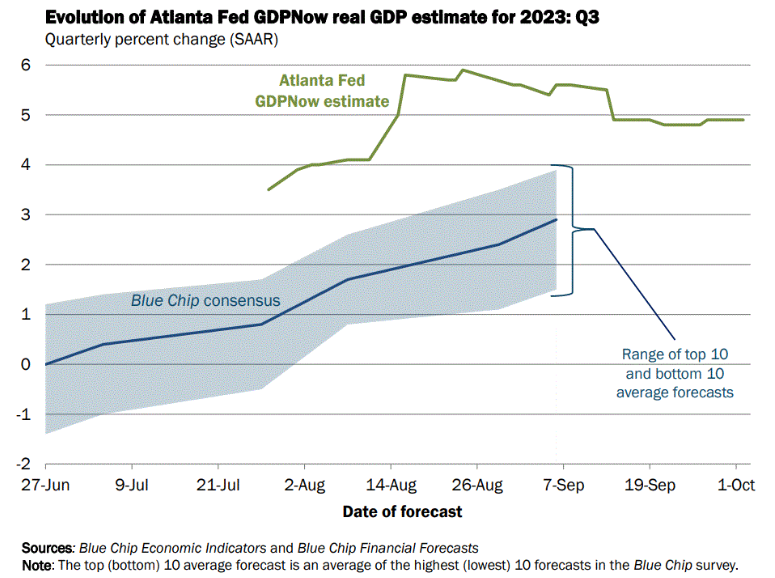
In August and September, the narrative changed. Inflation bottomed out and started drifting higher, the labor market remained tight, and economic growth accelerated, per the Atlanta Fed’s GDPNow, which predicted 3rd quarter GDP to come in at nearly 6%. The market finally priced in what the Federal Reserve has been saying for months. Namely, that rates will stay higher for longer in their pursuit of a 2% inflation rate.
Figure 1: Altanta Federal Reserve GDPNow Real GDP Estimate for Q3 2023
The Federal Reserve’s Sticky Inflation Problem
Since peaking in July 2022, headline inflation had been steadily falling on a year-over-year basis through June 2023. This “immaculate disinflation” took place without a recession or increase in unemployment. Historically, a recession was required to produce a decline in inflation of the magnitude that we have experienced. The “soft landing” scenario assumes that this time is different and inflation falls to the Federal Reserve’s 2% target without a recession unfolding.
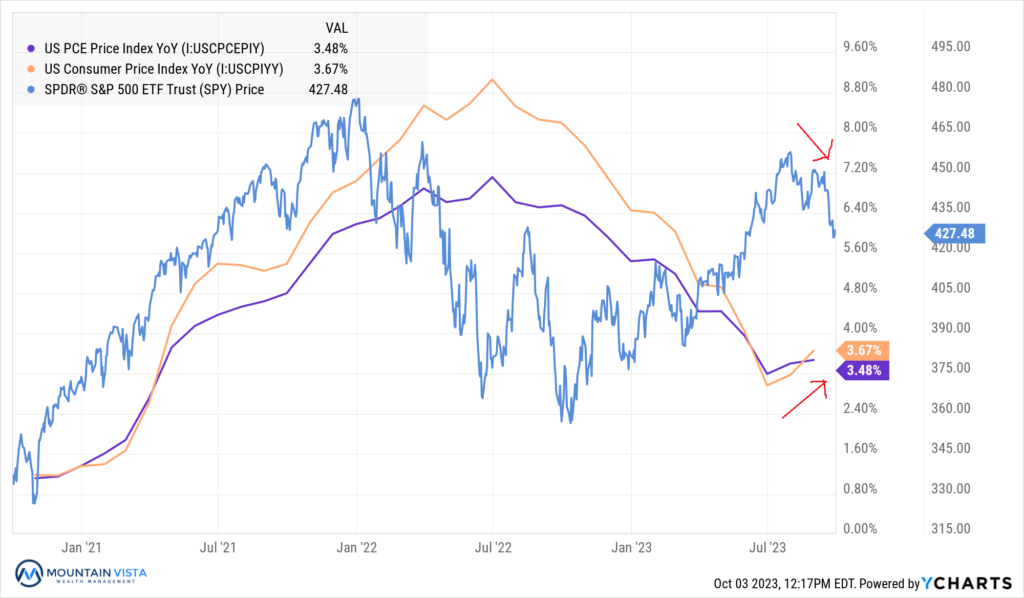
With PCE and CPI ticking up for two consecutive months, coupled with accelerating GDP growth and a resilient labor market, investors have been forced to price in higher rates for longer and an increased risk of a recession. This is the “hard landing” scenario.
Figure 2: S&P 500 ETF vs. CPI and PCE YoY inflation
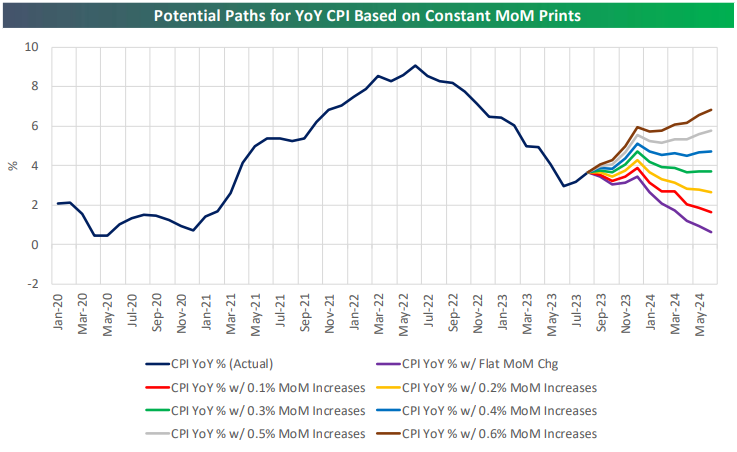
While inflation has come down a long way from this time last year, it is quite possible that we have seen the low print in CPI this year. As we pointed out in our Q2 2023 Investment Letter, the large month-over-month increases in early 2022 have been removed from the rolling 12-month CPI reading making it more difficult for CPI to continue falling on an annual basis. As you can see in Figure 3, unless we see flat or declining monthly readings, CPI is likely to drift higher into year end.
Figure 3: Potential Future CPI Paths
“Typical” Stock Market Returns
Most investors have heard that the stock market has returned ~8% over the long-term. Since 1928, the average annual return is just shy of 8%, supporting the often-quoted long-term average. Recent history has actually provided investors with stronger returns. Over the last 10 years, the S&P 500 has returned almost 10% on average.
Despite the stability of long-term returns, the stock market rarely delivers the long-term average in any individual year. As you can see in the Figure 4, annual returns are extremely volatile. In fact, returns have been between 5% and 10% only 6% of the time. The market is just as likely to be down more than (-20%) or up over 32%!
Figure 4: Annual Returns of the S&P 500 since 1928
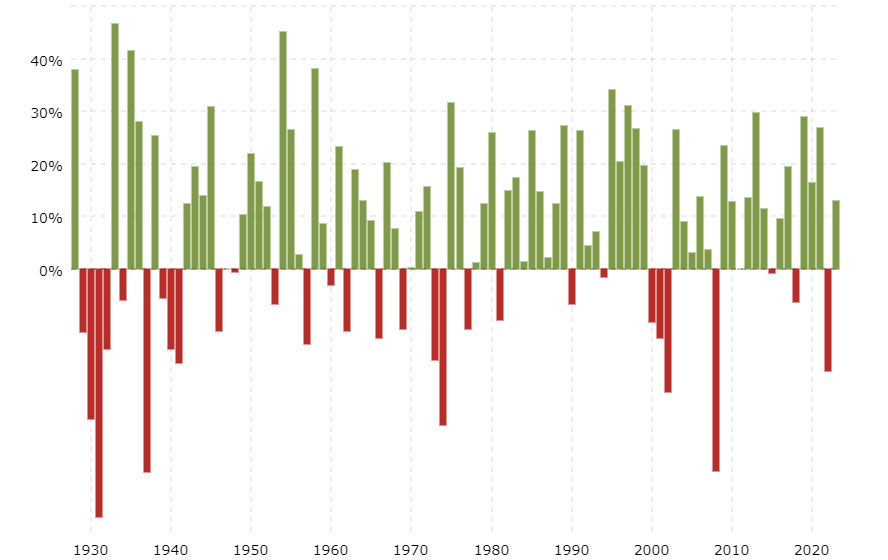
Source: https://www.macrotrends.net/2526/sp-500-historical-annual-returns
This volatility, coupled with poor investor behavior, is why so many investors underperform the market. Increasing your equity exposure during bull markets and/or reducing exposure during corrections will result in a long-term return that is less than the markets over time.
By sticking to a long-term asset allocation, an investor increases the likelihood that they earn the market’s attractive long-term returns. Furthermore, by rebalancing periodically, an investor will be buying low and selling high. This could result in outperformance over time, while maintaining a consistent risk exposure to a market decline.
EQUITY MARKET
Figure 5: Equity Index ETF Returns
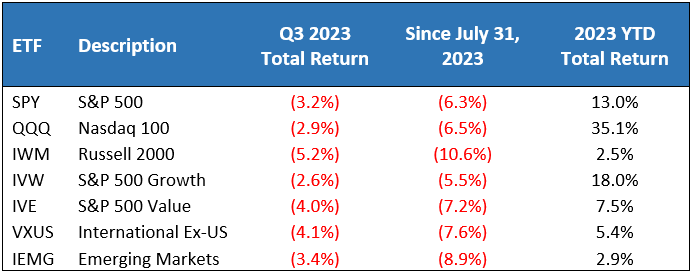
Equity markets slipped in the 3rd quarter of 2023. SPY (S&P 500 ETF) and QQQ (Nasdaq 100 ETF) returned (-3.2%) and (-2.9%) in the quarter, respectively, resulting in year-to-date gains of 13.0% and 35.1%, respectively. The Nasdaq 100 narrowly outperformed the S&P 500, given its relatively high exposure to large capitalization technology stocks.
Small capitalization stocks were also under pressure in the quarter, underperforming the S&P 500 by (-2.0%). IWM (Russell 2000 ETF) returned (-5.2%) in the 3rd quarter and is only higher by 2.5% year-to-date. The ratio of the Russell 2000 to the S&P 500 remains at depressed levels last seen during the “Dotcom Bubble” of the last 90s/early 2000s. With a greater reliance on floating rate debt, these stocks may continue to struggle if the Federal Reserve keeps rates elevated for an extended period.
Growth stocks outperformed Value stocks for the 3rd quarter in a row, reversing Value’s dominance during the prior year. IVW (S&P 500 Growth ETF) and IVE (S&P 500 Value ETF) generated quarterly returns of (-2.6%) and (-4.0%), respectively, resulting in a 1.4% outperformance by Growth during the quarter and 10% year-to-date.
International and Emerging Markets both lagged the S&P 500 in the 3rd quarter. VXUS (International ETF) and IEMG (Emerging Market ETF) produced returns of (-4.1%) and (-3.4%), respectively. Given the strength of the U.S. Dollar over the quarter, it could have been worse.
We remain marginally underweight equities in most portfolios. With short-term interest rates north of 5% and a lot of uncertainty about the economy in 2024, we like having a little dry powder to take advantage of potential opportunities that may present themselves.
Figure 6: Equity Sector Returns
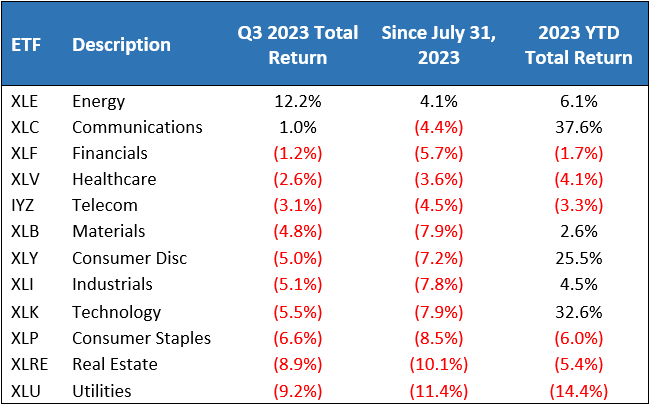
At the sector level, the 3rd quarter looked like an aftershock of 2022. XLE (Energy Sector ETF) was far-and-away the leading sector with a 12.2% return in the 3rd quarter. XLC (Communications Sector ETF) and XLF (Financial Sector ETF) rounded out the top 3 with returns of 1.0% and (-1.2%), respectively.
XLU (Utilities Sector ETF) and XLRE (Real Estate Sector ETF) were the worst performing sectors in the quarter. XLU and XLRE returned (-9.2%) and (-8.9%), respectively. These yield sensitive sectors were severely punished as long-term interest rates increased meaningfully over the quarter, making their dividends less attractive.
We have removed our small XLV (Healthcare Sector ETF) overweight as defensive sectors have been performing poorly in the current environment. We also wanted market weight exposure to the market leaders, should we rally into year end.
Figure 7: Equity Sector Quarterly Total Return

FIXED INCOME MARKET
Figure 8: Fixed Income Returns
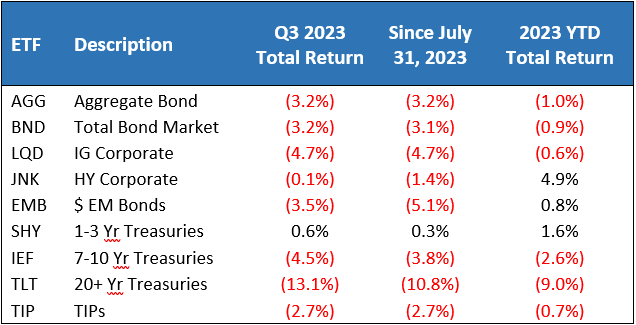
Fixed income saw a lot of volatility in the 3rd quarter. The 10-year Treasury yield increased 78 bps over the quarter and is 151 bps higher than the April low. This repricing is a sign that investors are “throwing in the towel” on the idea that rate cuts are coming in the near-term.
SHY (1-3 Yr Treasury ETF) and JNK (HY Corporate ETF) were the top sectors with quarterly returns of 0.6% and (-0.1%), respectively. SHY’s and JNK’s short duration and high yields insulated the ETFs from the dramatic repricing of long treasuries. Also, JNK was insulated by stable credit spreads, despite the volatility in equities.
TLT (20+ Year US Treasury ETF) crashed (-13.1%) in the quarter, bringing the year-to-date return to (-9.0%). The rest of the Fixed Income complex was lower by approximately (-3%) to (-4%).
Ironically, this quick increase in long-term interest rates, which was a response to a strong economy, has tightened financial conditions materially and will, ultimately, slow the economy.
Figure 9: U.S. Treasury Yields and 2/10 Spread
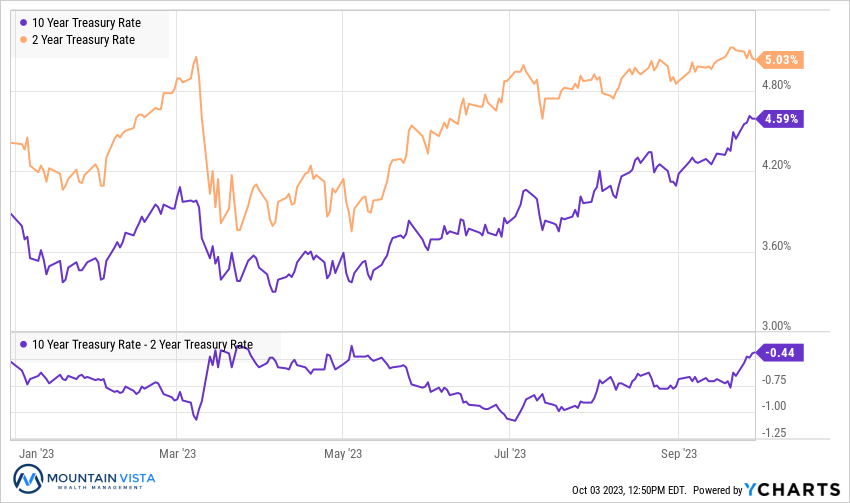
In September, the Federal Reserve left the Federal Funds rate unchanged at 5.25% to 5.50%. They also released their revised Summary of Economic Projections, which showed that FOMC participants upgraded economic growth, lowered unemployment, extended the time necessary for inflation to fall to 2%, and increased the expected Fed Funds rate projections for 2024 and 2025.
The Fed’s hawkish projections, coupled with resilient economic data, kicked off a repricing of medium/long-term treasury yields and the latest round of equity volatility.
The U.S. Treasury curve remains inverted, but the sell-off in long-term treasuries reduced the 2-year/10-year spread from a trough of (-108 bps) to (-44 bps).
Figure 10: U.S. Corporate Credit Spreads
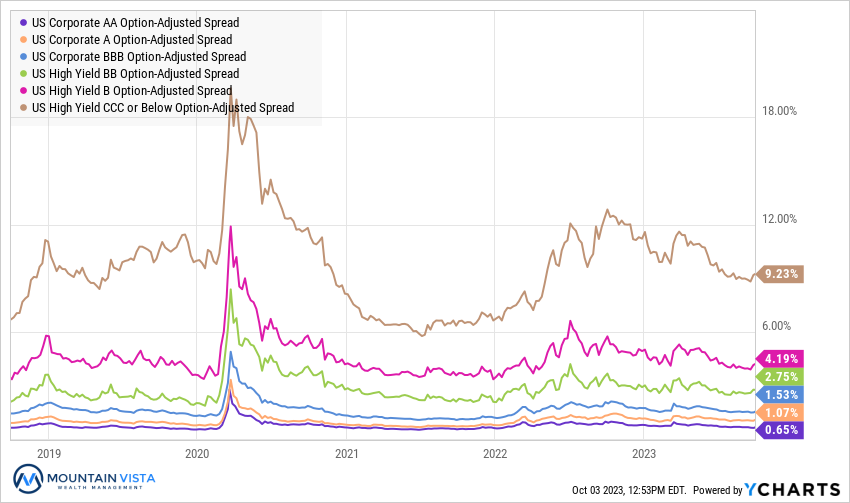
Despite the volatility in the equity and treasury markets, corporate credit spreads were marginally tighter from the beginning of the quarter. CCC-rated bond spreads tightened by (-20 bps), while AA-rated bond spreads tightened by (-6 bps). BB-rated bond spreads widened by 11 bps and were the only part of the credit curve to widen.
CCC spreads are moderately elevated, but they by no means signal an imminent recession. At current levels, credit spreads support the idea that this equity sell-off is likely a garden variety correction, but we will be watching spreads closely for signs of deterioration.
CONCLUSION
Whenever markets get volatile, I find it useful to step back and look at the big picture. While the near-term seems very uncertain, I take comfort in the fact that valuations are substantially cheaper than they have been for a very long time. Investors can currently earn over 5% taking virtually no risk in T-bills, multiples for stocks are back to normal levels and inflation, while still higher than the Fed would like, is well off of the boil.
Over the medium and long-term a diversified investor should earn attractive returns moving forward. While there will be ups and downs, manage your emotions and avoid making dramatic changes to your portfolio at extreme sentiment levels.
Thank you all for your continued support! We are dedicated to helping you navigate this uncertain time and are constantly looking for ways to improve the risk-reward profile of your investment portfolio.
Sincerely,
Jonathan R. Heagle, CFP®, CFA
President and Chief Investment Officer
Disclaimer
The views and opinions expressed are for informational and educational purposes only as of the date of writing and may change at any time based on market or other conditions and may not come to pass. This material is not intended to be relied upon as investment advice or recommendations, does not constitute a solicitation to buy or sell securities and should not be considered specific legal, investment or tax advice. The information provided does not take into account the specific objectives, financial situation, or particular needs of any specific person. All investments carry a certain degree of risk and there is no assurance that an investment will provide positive performance over any period of time. Equity investments are subject to market risk or the risk that stocks will decline in response to such factors as adverse company news or industry developments or a general economic decline. Debt or fixed income securities are subject to market risk, credit risk, interest rate risk, call risk, tax risk, political and economic risk, and income risk. As interest rates rise, bond prices fall. Non-investment-grade bonds involve heightened credit risk, liquidity risk, and potential for default. Foreign investing involves additional risks, including currency fluctuation, political and economic instability, lack of liquidity and differing legal and accounting standards. These risks are magnified in emerging markets. Past performance is no guarantee of future results.