 INTRODUCTION
“Everybody has some information. The function of the markets is to aggregate that information, evaluate it, and get it incorporated into prices.”
– Merton Miller, Economist and Nobel Laureate
At Mountain Vista, we periodically remind our clients that the market is forward-looking and by the time you are reading the latest clickbait article, the stock market has already reflected that information. With the increased availability of data and the adoption of quantitative, machine-driven trading strategies, the market reacts to new information almost instantly. In the stock market, information is reflected through a new price.
While this new technology and market structure present opportunities for very sophisticated trading firms that rely on being a fraction of a second faster than their competition, a typical saver could get themselves in trouble by selling after bad news or buying after good.
The unwind of the Japanese “carry trade” on August 5th reminded us once again how fast markets move these days. Over three trading days, the S&P 500 fell (-8%) and the VIX, a measure of expected volatility, reached levels only experienced during crises like the COVID crash in 2020 and the global financial crisis in 2008/9. In a little over a week, the market recovered all of these losses. I feel for the folks that turned on CNBC, read a few panicked headlines and hit the sell button.
The best way for someone saving for retirement to avoid these pitfalls is to focus on the long-term, construct a portfolio that is appropriately risk-adjusted for their situation, diversify across different asset classes and leave enough liquidity to be opportunistic when the market goes “on sale”.
Thank you to our amazing clients for trusting us to help you secure your retirement for another quarter! If you have any questions about anything in this letter, do not hesitate to reach out to your advisor.
Sincerely,
Jonathan R. Heagle, CFP®, CFA
President and Chief Investment Officer
QUARTERLY ROUNDUP
Market Performance Overview
The S&P 500 demonstrated resilience in the third quarter of 2024, delivering a robust total return of 5.8% despite encountering some challenges. Notably, market leadership expanded beyond the “Magnificent 7” to encompass a broader range of stocks. This shift was evidenced by the Russell 2000’s impressive 9.2% quarterly return, which significantly outpaced the Nasdaq 100’s modest 2.0% gain.
However, the journey to these gains was not without turbulence. In early August, the S&P 500 and Nasdaq 100 experienced significant drawdowns of (-8.4%) and (-13.6%), respectively. This correction was triggered by an unexpected rate hike from the Bank of Japan, driving the VIX (a measure of expected volatility) to levels typically seen only during major crises like COVID-19 or the Global Financial Crisis. Unlike those prior time periods, with the current economy doing fine, the extreme market reaction was an indicator of bad positioning, rather than a fundamental issue in the economy.
International stocks emerged as strong performers in Q3, with the VXUS (International ETF) outpacing the S&P 500 by 2%. This outperformance was fueled by a weakening dollar and substantial Chinese stimulus announced in late September. The impact of these factors was particularly evident in the MCHI (China ETF), which surged approximately 25% in the final two weeks of the quarter.
The fixed income market also delivered strong returns across various maturities. The AGG (U.S. Aggregate Bond ETF) generated an impressive 5.3% total return for the quarter. This performance was supported by declining inflation, which continued to approach the Federal Reserve’s 2% target, and the anticipation of the first rate cut of the cycle, creating favorable conditions for the bond market.
Federal Reserve Delivers 50 bps Rate Cut
On September 18th, 2024, the Federal Reserve (Fed) implemented a significant 50 basis point (0.5%) cut to the overnight Federal Funds rate, lowering the target range from 5.25-5.5% to 4.75-5%. This decision came after a period of intense speculation, with market expectations divided between a 25 and 50 basis point reduction.
The rate cut marks a pivotal shift in monetary policy. Since early 2022, the Fed had been aggressively raising rates from near-zero levels to combat surging inflation. After a cumulative increase of 5.25 percentage points over 18 months, rates had remained steady for more than a year.
While some feared that a 50-basis point cut might signal the Fed’s concerns about economic health or suggest insider knowledge, the reality is more nuanced. This move primarily acknowledges the significant improvement in inflation metrics, which had rendered the existing policy increasingly restrictive as inflation rates declined. It’s crucial to understand that the restrictiveness of monetary policy is determined not by the absolute level of interest rates alone, but by their relationship to inflation rates.
Accompanying the rate decision, the Federal Reserve Board members released their Summary of Economic Projections. This document provides valuable insights into the Fed’s outlook on key economic indicators such as GDP, inflation, and unemployment. Notable changes included a downward revision of near-term inflation projections and a more gradual pace of anticipated rate cuts over the next 18 months.
Key points from the projections include:
- The median Board member now expects PCE (Personal Consumption Expenditures) inflation to reach 2.1% by the end of 2025, approaching the Fed’s 2% target.
- The forecast includes 1-2 additional 25 basis point cuts through the end of 2024.
- Four more rate cuts are anticipated in 2025.
- The Federal Funds rate is expected to bottom out at approximately 2.9%.
These projections suggest a cautiously optimistic outlook from the Fed, balancing inflation control with support for economic growth.
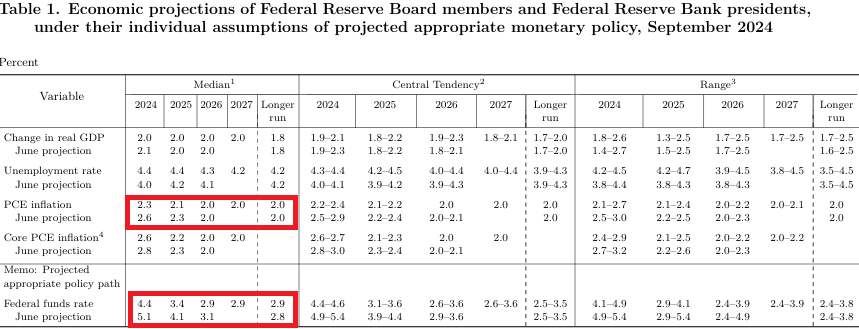
https://www.federalreserve.gov/monetarypolicy/files/fomcprojtabl20240918.pdf
Market Breadth Improves
In our second quarter commentary, we drew attention to the narrowing market breadth and the S&P 500’s heavy reliance on the performance of the “Magnificent 7” stocks. While many market observers expressed concern about this concentrated leadership and warned of a potential valuation correction, we presented a more nuanced view. We suggested that an alternative scenario could unfold where the broader market would step up to drive performance. As it turns out, this latter scenario materialized in the third quarter of 2024.
By the end of July, the divergence between the S&P 500 and the cumulative advance/decline line had reached significant levels. However, August and September saw a notable shift in market dynamics. The largest stocks, which had previously led the market, experienced weakness that pulled down the overall S&P 500. Concurrently, the rest of the market demonstrated resilience and performed well.

Source: Bespoke Investment Group
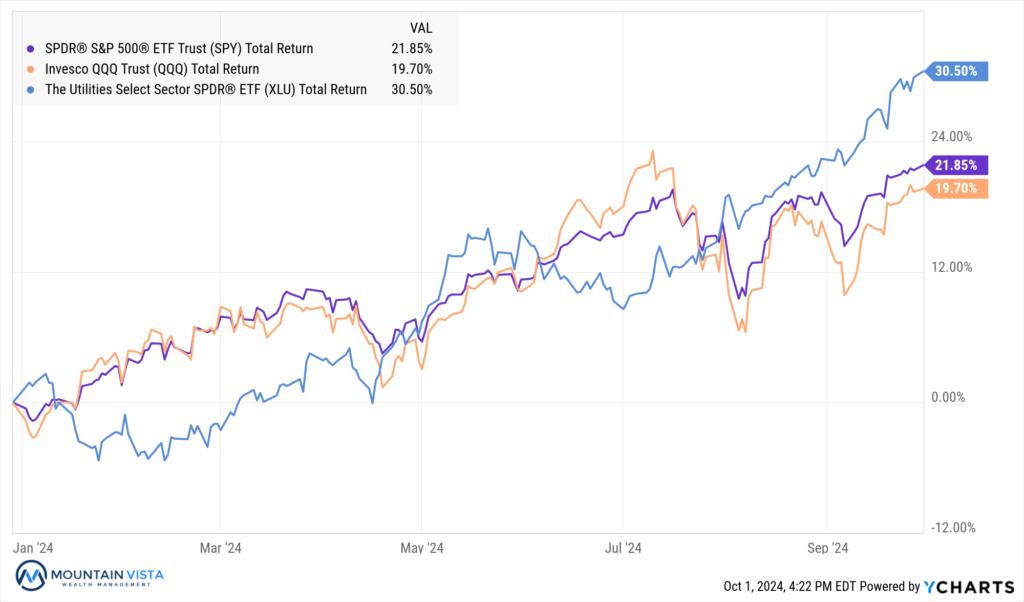
Surprising Leadership from Utilities
Conventional wisdom suggests that in a robust bull market, cyclical and high-beta sectors such as Technology or Consumer Discretionary typically lead the charge. Their strong performance in such conditions is often attributed to high growth rates and sensitivity to economic trends.
However, 2024 has defied these expectations. The Utilities sector, known for its low volatility with a beta of just 0.6, has emerged as the unexpected frontrunner. It has delivered an impressive year-to-date total return of 30.5%, significantly outpacing other sectors. The Communications sector follows in second place, albeit at a considerable distance, with a total return of 25.5% – a performance largely driven by its 20% allocation to META.
Several factors have converged to create this favorable environment for utilities:
- Declining interest rates have reduced funding costs for utility companies, enhancing their financial position.
- Lower rates have also made utility dividends more attractive to yield-seeking investors.
- The explosive growth in data centers and artificial intelligence has dramatically increased power demand, boosting growth expectations for the sector.
The surge in energy demand is so significant that it’s spurring unprecedented moves in the industry. A striking example is Constellation Energy’s consideration of reactivating the Three Mile Island nuclear power plant, with the sole purpose of supplying power to Microsoft. This development underscores the transformative impact of tech-driven energy consumption on traditionally stable sectors like Utilities.
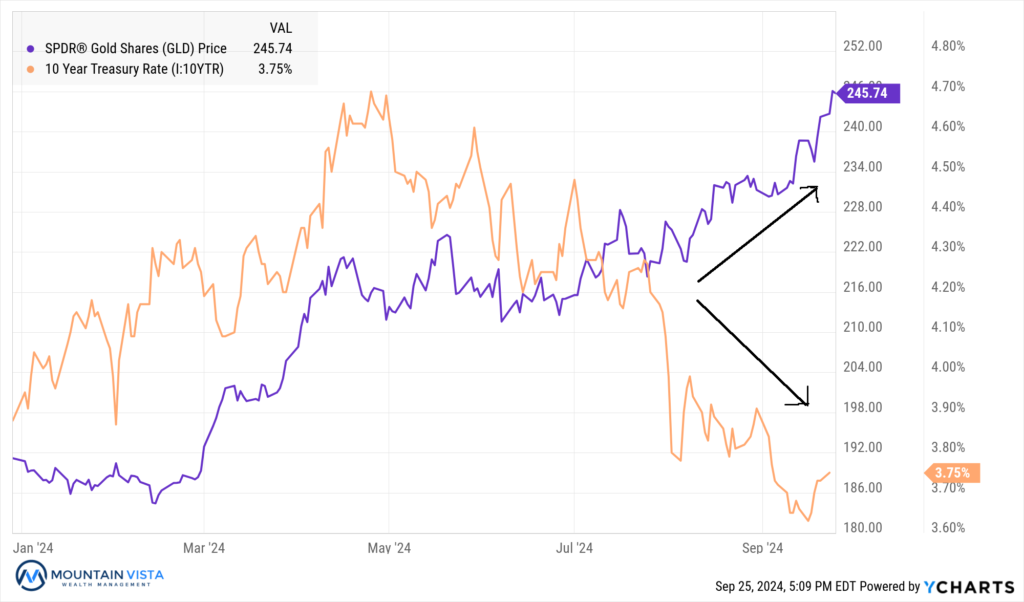
Gold Shines Bright
In recent years, Gold as an investment had taken a back seat to Bitcoin, its digital substitute. This is not completely surprising given golds poor performance since 2011. That all changed in 2024 and GLD (Gold ETF) is up 27.1% year-to-date.
Here are few explanations for why gold has been so strong:
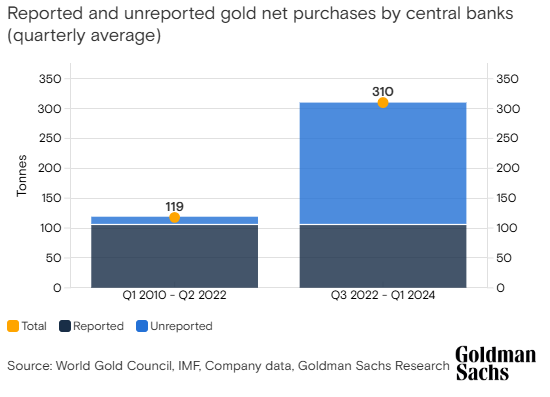
- The confiscation of Russia’s holdings of U.S. Treasuries has driven central banks to hold more gold in lieu of treasuries. According to Goldman Sachs, central bank purchases have roughly tripled since Russia’s invasion of Ukraine.
- With bond yields falling, the opportunity cost of holding gold, relative to bonds has decreased. An investor who buys gold forgoes the ability to earn dividends or interest.
- Geopolitical uncertainty is on the rise with military activity in Ukraine and the Middle East. Also, the upcoming U.S. election presents potential risks around process, as well as policy. Both candidates’ policies are likely to maintain high deficits, which could provide upward pressure on inflation.
Looking Forward
As far as the stock market goes, the current environment is as good as it gets. The Federal Reserve is starting to lower rates, yields are dropping, inflation is cooling, financial conditions are loosening, the economy is running at ~3% real GDP growth, and job creation is just fine. For all of these reasons, the S&P 500 closed the month at the all-time high.
At a forward P/E ratio of 21, the S&P 500 is not cheap historically speaking. It reached 22x in 2021 and 24x in the late 90s, but we know how that played out. While the market does look more reasonable after removing the Mega Cap stocks, it is hard to argue that stocks are not richly valued. The market does not have to correct tomorrow, but the risk reward is certainly less favorable than 12-24 months ago.
In fixed income, yields have come down dramatically on expectations of a slowing economy and expected rate cuts. As we have mentioned multiple times, we do not think the economy is performing as weak as the narrative presented by others, so long-term bond yields may have gotten ahead of themselves. Absent a recession, a 10-year treasury yield of 4% seems reasonable.
Commodities may experience a rebound due to a stronger than expected economy and renewed stimulus measures out of China. Furthermore, any disruptions to the oil market from the conflict in the Middle East will likely send prices of crude higher quickly.
This complex interplay of economic factors, market dynamics, and geopolitical events underscores the importance of maintaining a diversified portfolio and staying attuned to evolving market conditions. As always, we appreciate your time in reviewing this commentary and welcome any questions that you may have on these or other topics of interest.
APPENDIX
Equity Index ETF Total Return
| ETF | Description | Q3 2024 Total Return | Since August 5, 2024 | 2024 Total Return |
| SPY | S&P 500 | 5.8% | 11.2% | 21.9% |
| QQQ | Nasdaq 100 | 2.0% | 12.3% | 19.7% |
| IWM | Russell 2000 | 9.2% | 9.6% | 11.0% |
| IVW | S&P 500 Growth | 3.6% | 13.1% | 27.9% |
| IVE | S&P 500 Value | 9.0% | 8.8% | 15.1% |
| VXUS | International Ex-US | 7.8% | 12.0% | 13.5% |
| IEMG | Emerging Markets | 7.2% | 13.2% | 14.6% |
U.S. Equity Sector Total Return
| ETF | Description | Q3 2024 Total Return | Since August 5, 2024 | 2024 Total Return |
| XLU | Utilities | 19.4% | 12.5% | 30.5% |
| XLRE | Real Estate | 17.1% | 10.7% | 14.2% |
| IYZ | Telecom | 16.9% | 16.7% | 13.0% |
| XLI | Industrials | 11.5% | 12.7% | 20.0% |
| XLF | Financials | 10.6% | 11.4% | 21.9% |
| XLY | Consumer Disc | 10.1% | 17.3% | 12.8% |
| XLB | Materials | 9.6% | 10.0% | 14.1% |
| XLP | Consumer Staples | 9.0% | 7.4% | 17.6% |
| XLV | Healthcare | 6.1% | 5.3% | 14.2% |
| XLC | Communications | 5.9% | 10.2% | 25.5% |
| XLK | Technology | (0.0%) | 14.3% | 17.9% |
| XLE | Energy | (2.9%) | 2.4% | 7.3% |
U.S. Equity Sector Total Return

Global Equity ETF Total Return

Fixed Income ETF Total Return
| ETF | Description | Q3 2024 Total Return | Since August 5, 2024 | 2024 Total Return |
| AGG | Aggregate Bond | 5.3% | 1.3% | 4.6% |
| BND | Total Bond Market | 5.2% | 1.3% | 4.6% |
| LQD | IG Corporate | 6.6% | 2.8% | 5.2% |
| JNK | HY Corporate | 5.5% | 4.4% | 7.9% |
| EMB | $ EM Bonds | 7.1% | 4.8% | 8.7% |
| SHY | 1-3 Yr Treasuries | 2.9% | 1.0% | 4.0% |
| IEF | 7-10 Yr Treasuries | 5.7% | 0.6% | 4.2% |
| TLT | 20+ Yr Treasuries | 7.9% | (0.4%) | 1.9% |
| TIP | TIPs | 4.1% | 1.4% | 4.8% |
U.S. Treasury Yields and 2/10 Spread

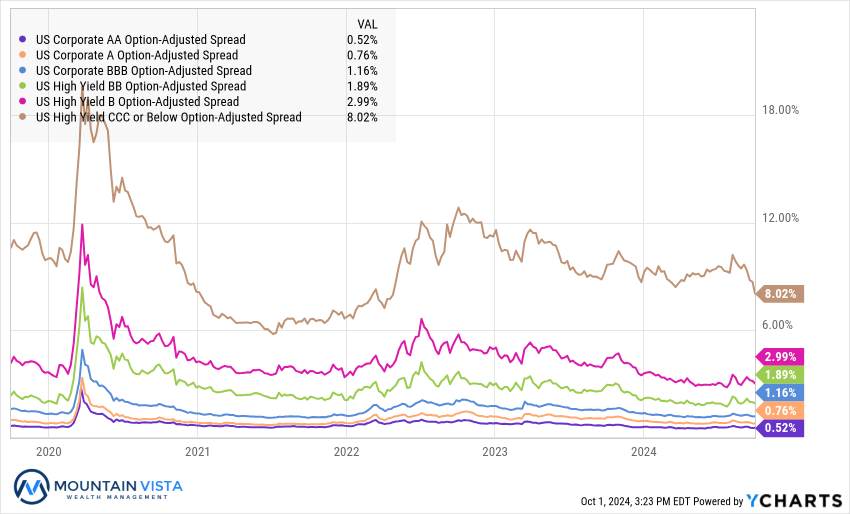
U.S. Corporate Credit Spreads
Commodity and Bitcoin Total Return
| ETF | Description | Q3 2024 Total Return | Since August 5, 2024 | 2024 Total Return |
| PDBC | Diversified Commodity | (4.4%) | 1.7% | 1.0% |
| GLD | Gold | 13.0% | 9.3% | 27.1% |
| DBB | Base Metals | 3.2% | 13.3% | 13.6% |
| USO | Oil | (12.1%) | (4.5%) | 4.9% |
| FBTC | Bitcoin* | 5.9% | 18.7% | 35.8% |
| * FBTC 2024 Total Return calculated from January 11, 2024 | ||||
Disclaimer
The views and opinions expressed are for informational and educational purposes only as of the date of writing and may change at any time based on market or other conditions and may not come to pass. This material is not intended to be relied upon as investment advice or recommendations, does not constitute a solicitation to buy or sell securities and should not be considered specific legal, investment or tax advice. The information provided does not take into account the specific objectives, financial situation, or particular needs of any specific person. All investments carry a certain degree of risk and there is no assurance that an investment will provide positive performance over any period of time. Equity investments are subject to market risk or the risk that stocks will decline in response to such factors as adverse company news or industry developments or a general economic decline. Debt or fixed income securities are subject to market risk, credit risk, interest rate risk, call risk, tax risk, political and economic risk, and income risk. As interest rates rise, bond prices fall. Non-investment-grade bonds involve heightened credit risk, liquidity risk, and potential for default. Foreign investing involves additional risks, including currency fluctuation, political and economic instability, lack of liquidity and differing legal and accounting standards. These risks are magnified in emerging markets. Past performance is no guarantee of future results.