
INTRODUCTION
“October. This is one of the peculiarly dangerous months to speculate in stocks. The others are July, January, September, April, November, May, March, June, December, August, and February.” – Mark Twain
Over the years, we’ve often discussed one of the most consistent challenges investors face: the difficulty of timing the market. Too often, investors buy near the highs when optimism is strongest and sell near the lows when fear is most intense. While the reasons are many, the root cause is usually human nature—our instincts are wired for survival, not successful investing.
During market declines, alarming headlines dominate the news, and the pain of seeing portfolio values fall triggers a strong urge to seek safety. Acting on that impulse, however, often means locking in losses and undoing years of compounded growth. Conversely, in markets like the one we’re experiencing today, optimism replaces fear. We tell ourselves we’ll “ride out the next downturn” and take comfort in the impressive returns of fast-growing companies. The fear we felt just months ago fades, risk feels distant, and valuations quietly stretch to new highs.
This cycle of fear and greed is as old as markets themselves. While no one can perfectly call tops or bottoms, awareness of these behavioral biases can help us avoid costly mistakes. Before making significant portfolio changes, we encourage you to pause and reflect: are you reacting rationally, or emotionally?
There is a lot of speculative activity in the market right now, as technology companies are spending hundreds of billions of dollars chasing the dream of Artificial General Intelligence. In addition to the technology companies themselves, the values of utility, industrial and even financial companies are being propped up by this increased economic activity.
This virtuous cycle does not need to end in short order and this cycle may not end in a “Dot-com” burst, but be aware that high price-to-earnings multiples require high future growth. Be very careful about increasing risk and chasing what has been a spectacular run.
We’re grateful to work with such thoughtful, engaged clients, and we never take your trust for granted. Thank you for allowing us the privilege of safeguarding your hard-earned savings.
Sincerely,
Jonathan R. Heagle, CFP®, CFA
President and Chief Investment Officer
QUARTERLY ROUNDUP
Market Performance Overview
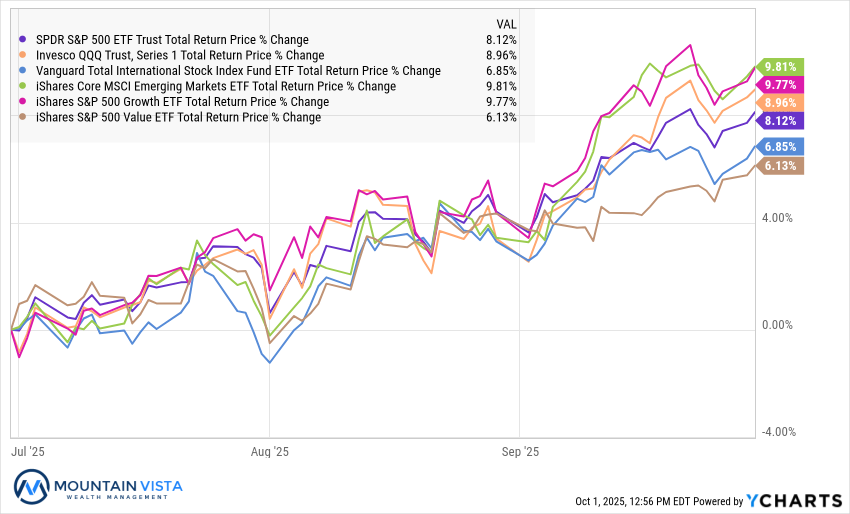
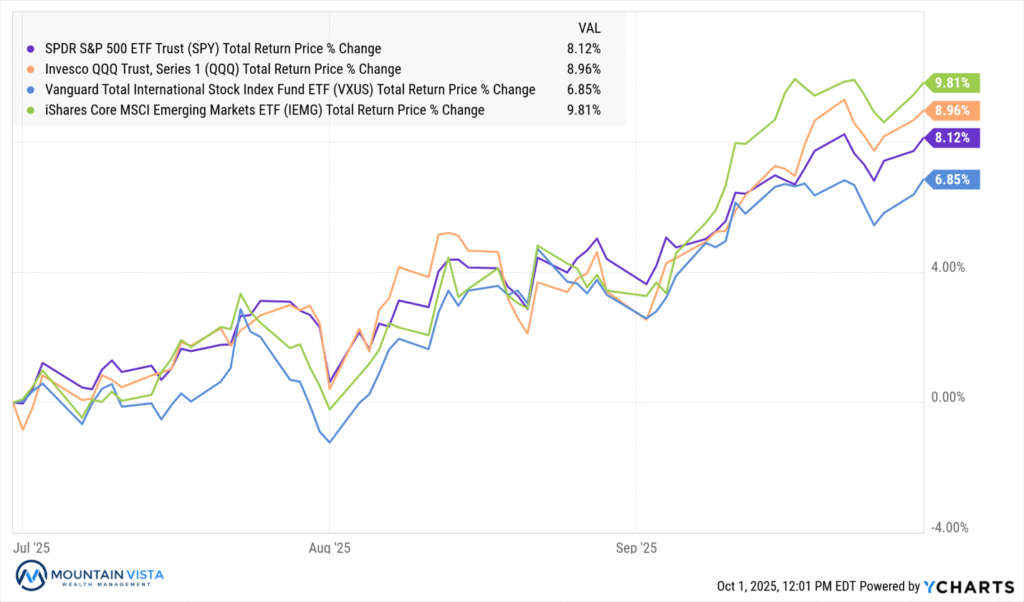
Global markets delivered strong results in the third quarter of 2025, with equities continuing to lead the way. In the U.S., large-cap benchmarks extended their rally as the S&P 500 gained 8.1% and the Nasdaq 100 rose 9.0%. Growth stocks once again outpaced value, with the IVW (S&P 500 Growth ETF) climbing 9.8% compared to a 6.1% increase for IVE (S&P 500 Value ETF). Small caps staged an even stronger rebound, as the Russell 2000 surged 12.4%, its best quarterly showing of the year. International markets kept pace with U.S. performance, as VXUS (International ex-US ETF) rose 6.8% and IEMG (Emerging Market ETF) advanced 9.8%, supported by renewed strength in Asia.
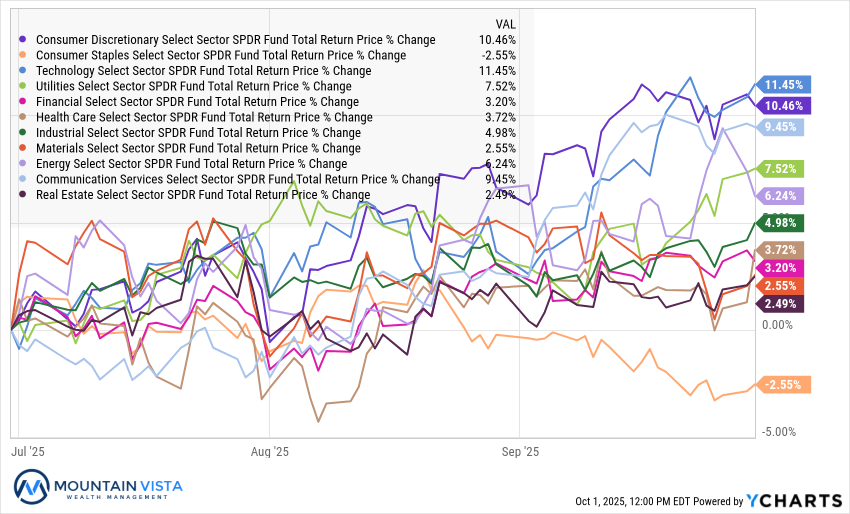
Figure 1: Various Equity Indices 3rd Quarter Total Returns
Sector leadership was concentrated in areas tied to innovation and discretionary consumer demand. Technology stocks gained 11.4%, followed closely by consumer discretionary at 10.5% and communications at 9.4%. Utilities and industrials added moderate gains, while healthcare, financials, and materials lagged the broader market. Consumer staples stood out on the downside, losing 2.5% for the quarter as investors rotated away from defensives. Energy rose 6.2%, though the move was tempered by relatively flat oil prices.
Commodities and alternative assets offered some of the quarter’s most dramatic moves. Gold surged 16.6%, extending its year-to-date rally to nearly 47% and reinforcing its role as a preferred hedge. Cryptocurrencies were also in focus, with Ethereum soaring 65.2% in the quarter, far outpacing Bitcoin’s 6.2% gain. Broader commodities delivered more modest results, with base metals climbing 6.0% and diversified baskets inching higher, while oil was little changed.
Fixed income posted positive but subdued returns. Investment-grade corporate bonds rose 2.8%, leading credit markets, while high yield added 2.4% and emerging-market debt advanced 4.1%. Treasuries produced steady gains across the curve, with short-term maturities up 1.1%, intermediate notes up 1.7%, and long bonds rising 2.4%. Inflation-protected securities also added 2.1%, reflecting steady demand for hedges.
Overall, the third quarter of 2025 reflected a clear risk-on tone. Equities, particularly small caps, growth stocks, and technology, drove performance, while gold and Ethereum provided standout gains among alternatives. Bonds contributed stable but more modest returns, leaving investors with a broadly positive backdrop heading into the final quarter of the year.
Datacenter Growth and the AI Trade Enter a New Risky Stage
Oracle’s latest earnings highlighted its bold ambition to scale up its AI cloud infrastructure. Its stock soared as much as 40%, even though their actual earnings report was modest. Driving the positive reaction was the announcement of large future contracts, or “Remaining Performance Obligations”, as you can see in Figure 2. Oracle is positioning itself as a central player in the generative AI arms race to drive revenue growth and market share versus their peers.
Figure 2: Oracle’s Remaining Performance Obligations
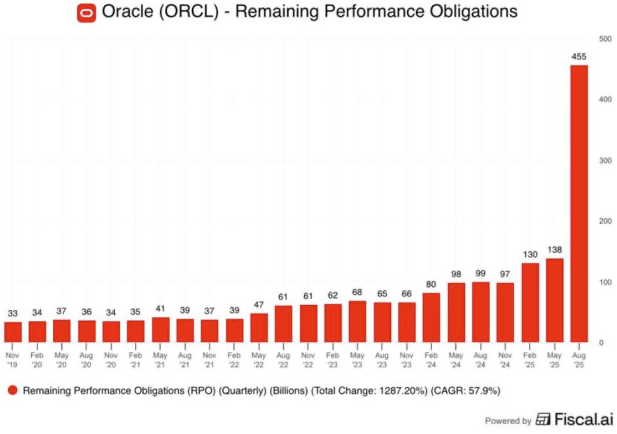
To meet the demands of OpenAI and other clients, Oracle has announced plans to accelerate its datacenter buildout. The company is racing to deploy massive clusters of GPUs and expand its global cloud footprint, with a particular focus on high-bandwidth interconnects that are critical for training large models. This level of investment could allow Oracle to close the gap with rivals like AWS, Microsoft, and Google Cloud, especially given the surging demand for AI compute capacity.
What is unique about Oracle’s proposed expansion is that they are expected to rely heavily on new debt issuance to fund its capital expansion. While the near-term revenue opportunity from AI clients appears strong, the long payback periods of these datacenter investments heighten the risk.
Furthermore, execution and counterparty risks are high. Any delays, cost overruns, or shifts in AI technology could challenge Oracle’s ability to generate the returns it envisions. Should OpenAI not be able to meet their $300 billion 5-year contract, and Oracle fails to diversify their client base, the large investment could sour.
The introduction of debt to fund capital expenditures and various circular investments between NVDA, OpenAI and their AI-related customers has many market participants reflecting on the internet boom of the late ‘90s/early 2000s.
The stock market indices have become very dependent upon investment in artificial intelligence and the promise of a future payout. If AI fails to deliver upon its lofty aspirations, a bear market will most likely follow.
Hiding Out in Equal-Weighted vs. Market Capitalization-Weighted S&P 500
In recent years, the S&P 500 has been increasingly driven by Large-Cap Technology stocks, and their concentration risk has grown. This has also driven a performance gap between the market-cap weighted and equal-weighted S&P 500 returns. This is yet another similarity between the current market environment and the Dot Com bubble.
Figure 3: Market- and Equal-Weighted S&P 500 Performance in Bull/Bear Markets
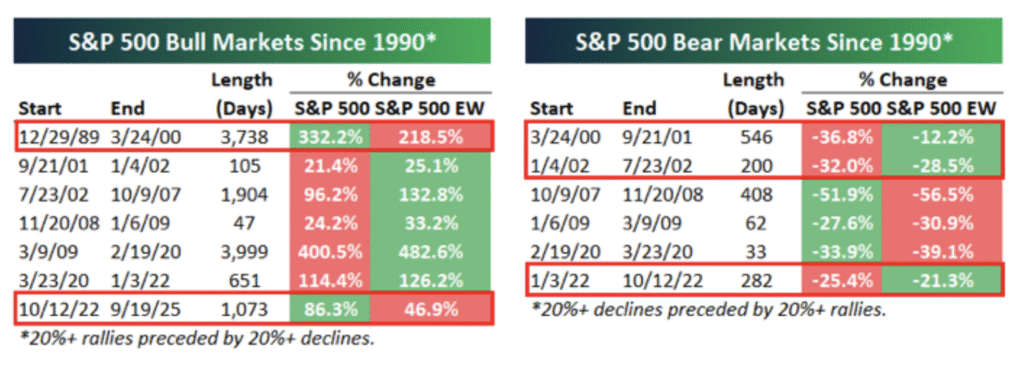
Source: Bespoke Investment Group
Figure 4: Market- and Equal-Weighted S&P 500 Performance Gaps
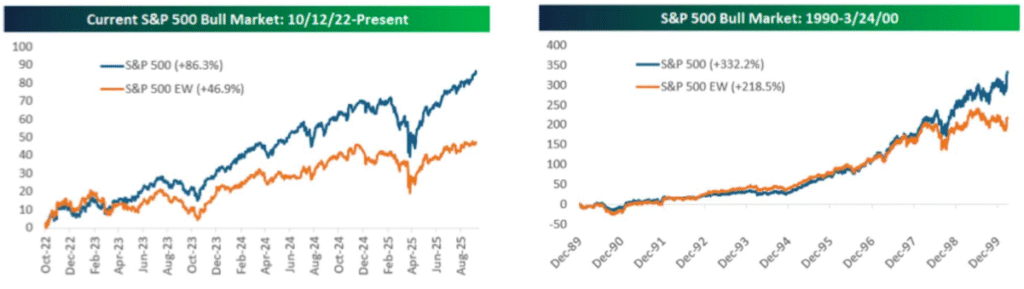
Source: Bespoke Investment Group
With so much of the market’s performance dependent upon the performance of these companies and the continued investment and success of artificial intelligence, equal-weighted may be poised to outperform again in a downturn.
Federal Reserve Cuts Rates For the First Time This Year
In their September meeting, the Federal Open Market Committee decided to lower the federal funds rate by 25 basis points, bringing the target range to 4.00%–4.25%. The decision marked the Fed’s first rate cut of 2025 and came amid signs of a softening labor market—a shift in the balance of risks toward downside concerns for employment. Nevertheless, while easing, the Fed retained a cautious posture, signaling that future adjustments would depend heavily on incoming data and the evolving inflation outlook.
The updated Summary of Economic Projections revealed that participants had revised down their expectations for economic growth in 2025, with median real GDP now projected at roughly 1.6%, down from earlier estimates, though still above June’s baseline. Unemployment projections remained relatively elevated, and inflation expectations were nudged higher—participants saw PCE inflation ending 2025 above prior estimates and not fully returning to 2% until perhaps 2027. On interest rates, the median dot-plot suggested additional cuts beyond September, but at a gradual pace: the SEP projected the federal funds rate to fall to the mid-3% range by year end and continue easing modestly through 2027.
Figure 5: FOMC September 2025 Summary of Economic Projections
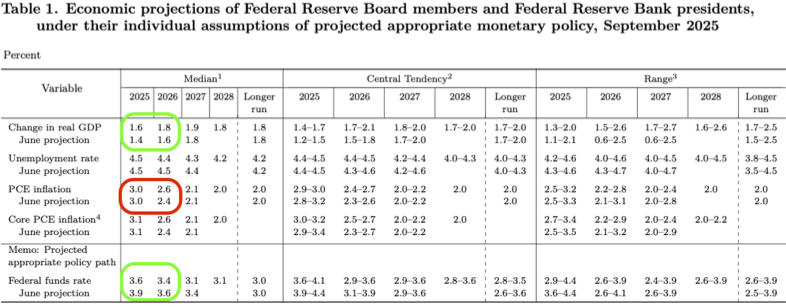
The main takeaway that we have from this meeting is that the Fed and the U.S. Government are “running the economy hot”, accepting elevated inflation to support employment and the economy. This is an attempt to grow ourselves out of the current debt burden through financial repression. This policy should be good for gold, bitcoin and equities over the medium term, but leaves markets exposed to runaway inflation and unexpected shocks.
Where is the Tariff Induced Stagflation?
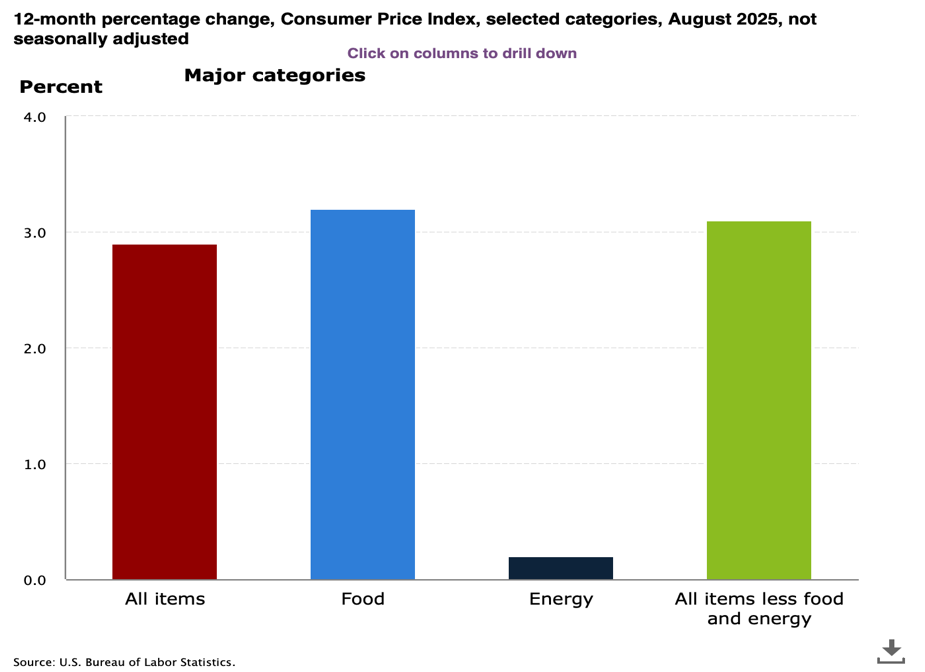
When tariffs were first announced, many economists and investors expected inflation to increase meaningfully while pushing growth downward. The University of Michigan reported consumer’s 1-year inflation expectationsreached a peak of 6.6% in May 2025. While inflation has remained sticky, in August the year-over-year increase in the Consumer Price Index was 2.9% for All Items and 3.1% for All Items less Food and Energy.
Figure 6: August 2025 Consumer Price Index Year-over-Year Change
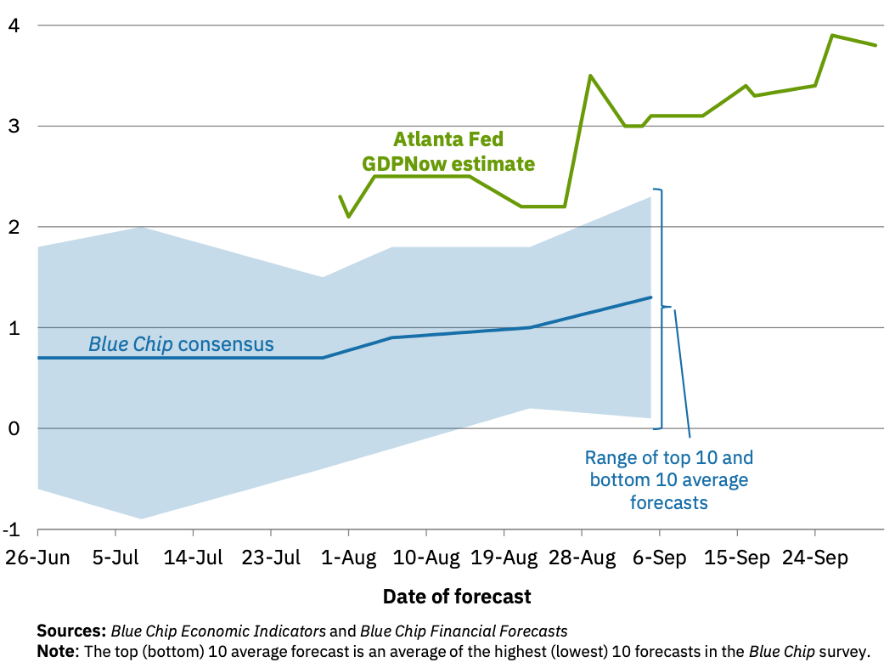
In or Q2 Investment Letter, we highlighted our belief that the economic data was in a soft patch due to uncertainties surrounding the tariffs. We also noted that the positive effects of tax cuts, deregulation and interest rate cuts were likely to “support the economy in the coming months and quarters”.
Real GDP growth for Q2 2025 came in at an annualized rate of 3.8%. As you can see in Figure 5, the Atlanta Fed’s GDPNow estimate for Q3 2025 is at a similar level. With inflation only ticking up marginally and growth booming, this is far from the scenario that many were anticipating 6 months ago.
Figure 7: Evolution of Atlanta Fed GDPNow real GDP estimate for Q3 2025
Looking Forward
By any traditional valuation metric, U.S. large-cap stocks are historically expensive. The S&P 500’s forward price-to-earnings multiple currently sits around 22-23x—matching the 2021 peak and approaching the 25x reached during the dot-com bubble. For perspective, between 2003 and 2019, the forward P/E ratio ranged between 10x and 18x. While we’re reluctant to time the market, these elevated valuations suggest future returns may be more modest than the mid-teens gain of the past decade, and new capital may find better opportunities elsewhere.
Beyond the S&P 500, valuations become more attractive. International, small-cap, and mid-cap stocks trade at considerably more reasonable levels—around 15-16x forward earnings. Though these segments have lagged for years, they offer valuable portfolio diversification, particularly if the current AI investment cycle proves unsustainable.
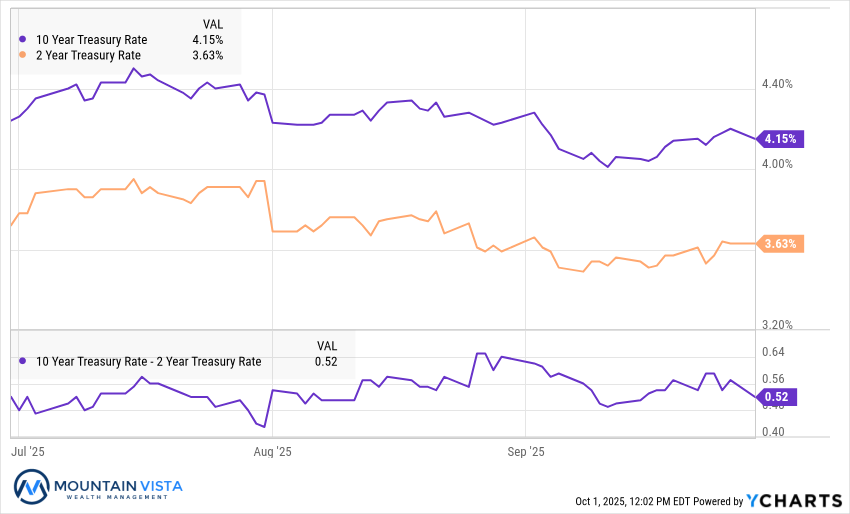
Fixed income faces crosscurrents. Ten-year Treasury yields have declined on expectations of Federal Reserve rate cuts and softening labor data. Yet the Fed is easing into what remains a resilient economy with inflation showing renewed persistence. While the Treasury market has focused on dovish factors thus far, an inflationary resurgence could quickly drive long-term yields higher.
Gold, Bitcoin and the U.S. Dollar have been more reflective of the recent move by the Federal Reserve to cut against a strong economic backdrop and sticky inflation. Gold and Bitcoin finished the 3rd quarter with year-to-date returns of 47% and 22%, respectively, while the ICE U.S. Dollar Index is down ~10% for the year. If the U.S. government continues to pursue a policy of financial repression, or holding rates artificially low to manage debt burdens at the expense of savers, Gold and Bitcoin should continue to perform.
We appreciate your review of this analysis and welcome any questions regarding these observations or other financial matters of interest.
APPENDIX
Equity Index ETF Total Return
| ETF | Description | Q3 2025 Total Return | Since April 8, 2025 | 2025 Total Return |
| SPY | S&P 500 | 8.1% | 35.0% | 14.7% |
| QQQ | Nasdaq 100 | 9.0% | 44.6% | 17.9% |
| IWM | Russell 2000 | 12.4% | 39.2% | 10.4% |
| IVW | S&P 500 Growth | 9.8% | 45.8% | 19.3% |
| IVE | S&P 500 Value | 6.1% | 23.7% | 9.5% |
| VXUS | International Ex-US | 6.8% | 33.9% | 26.6% |
| IEMG | Emerging Markets | 9.8% | 39.8% | 27.8% |
U.S. Equity Sector Total Return
| ETF | Description | Q3 2025 Total Return | Since April 8, 2025 | 2025 Total Return |
| XLK | Technology | 11.4% | 57.3% | 21.8% |
| XLY | Consumer Disc | 10.5% | 36.4% | 7.5% |
| XLC | Communications | 9.4% | 38.2% | 23.4% |
| IYZ | Telecom | 9.0% | 32.9% | 22.3% |
| XLU | Utilities | 7.5% | 21.0% | 17.6% |
| XLE | Energy | 6.2% | 18.8% | 6.9% |
| XLI | Industrials | 5.0% | 33.4% | 18.3% |
| XLV | Healthcare | 3.7% | 5.6% | 2.5% |
| XLF | Financials | 3.2% | 23.5% | 12.6% |
| XLB | Materials | 2.5% | 21.9% | 8.1% |
| XLRE | Real Estate | 2.5% | 15.5% | 6.0% |
| XLP | Consumer Staples | (2.5%) | 4.1% | 1.6% |
U.S. Equity Sector Total Return
Global Equity ETF Total Return
Fixed Income ETF Total Return
| ETF | Description | Q3 2025 Total Return | Since April 8, 2025 | 2025 Total Return |
| AGG | Aggregate Bond | 2.1% | 4.3% | 6.2% |
| BND | Total Bond Market | 2.0% | 4.3% | 6.1% |
| LQD | IG Corporate | 2.8% | 7.9% | 7.5% |
| JNK | HY Corporate | 2.4% | 10.4% | 7.3% |
| EMB | $ EM Bonds | 4.1% | 12.4% | 10.7% |
| SHY | 1-3 Yr Treasuries | 1.1% | 2.0% | 3.8% |
| IEF | 7-10 Yr Treasuries | 1.7% | 3.3% | 7.0% |
| TLT | 20+ Yr Treasuries | 2.4% | 3.1% | 5.3% |
| TIP | TIPs | 2.1% | 3.8% | 6.9% |
U.S. Treasury Yields and 2/10 Spread
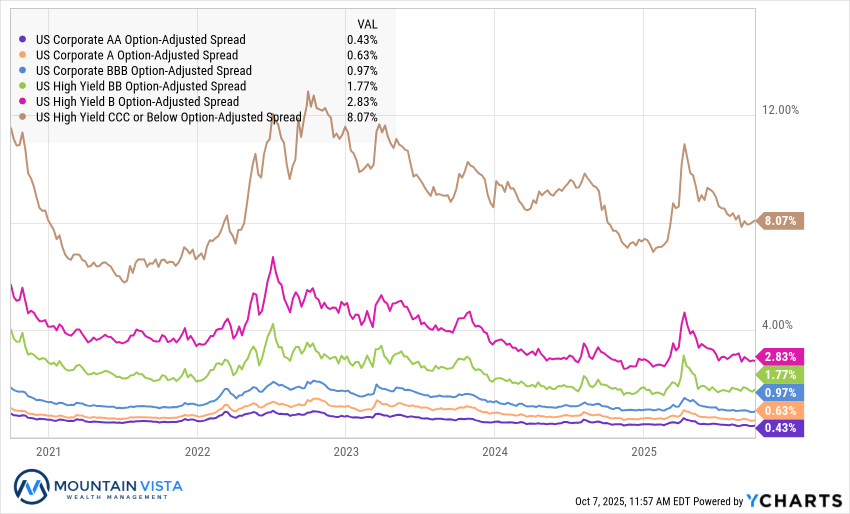
U.S. Corporate Credit Spreads
Commodity and Bitcoin Total Return
| ETF | Description | Q3 2025 Total Return | Since April 8, 2025 | 2025 Total Return |
| PDBC | Diversified Commodity | 3.0% | 10.0% | 3.4% |
| GLD | Gold | 16.6% | 29.2% | 46.8% |
| DBB | Base Metals | 6.0% | 19.2% | 9.0% |
| USO | Oil | 0.9% | 16.4% | (2.4%) |
| FBTC | Bitcoin | 6.2% | 49.0% | 22.3% |
| ETHA | Ethereum | 65.2% | 184.6% | 24.6% |
Disclaimer
The views and opinions expressed are for informational and educational purposes only as of the date of writing and may change at any time based on market or other conditions and may not come to pass. This material is not intended to be relied upon as investment advice or recommendations, does not constitute a solicitation to buy or sell securities and should not be considered specific legal, investment or tax advice. The information provided does not take into account the specific objectives, financial situation, or particular needs of any specific person. All investments carry a certain degree of risk and there is no assurance that an investment will provide positive performance over any period of time. Equity investments are subject to market risk or the risk that stocks will decline in response to such factors as adverse company news or industry developments or a general economic decline. Debt or fixed income securities are subject to market risk, credit risk, interest rate risk, call risk, tax risk, political and economic risk, and income risk. As interest rates rise, bond prices fall. Non-investment-grade bonds involve heightened credit risk, liquidity risk, and potential for default. Foreign investing involves additional risks, including currency fluctuation, political and economic instability, lack of liquidity and differing legal and accounting standards. These risks are magnified in emerging markets. Past performance is no guarantee of future results.