
INTRODUCTION
“Successful investing is about managing risk, not avoiding it.” – Benjamin Graham
A year ago, we were contemplating whether the economy was heading towards recession, driven by tit-for-tat tariff increases resulting from the U.S. and China’s trade negotiations. Many investors were questioning if the bull market that began in 2009 was over and if the 20% correction in the S&P 500 was the start of something much worse in 2019.
We now know that it was ultimately a buying opportunity and that the market was far too pessimistic about the economy. We also know that it is important to ride out downturns in the market and even increase our exposure to equities when the market goes “on sale”. After bottoming on Christmas Eve day, the SPY (S&P 500 ETF) went on to return almost 40% through the end of 2019.
Pointing out the proper course of action is easy with the benefit of hindsight and when our hard-earned life savings are not suffering losses, but it is much more difficult to execute in practice. That is why it is important to plan ahead, rebalance programmatically and construct a portfolio with a suitable amount of risk. As the famous quote from Benjamin Graham above suggests, by taking risk, we are rewarded with the compound returns that the market delivers to long-term investors, but there is also a need to manage the risks taken, so that we are able to stay the course during difficult periods.
At Mountain Vista, we invest a lot of time upfront to determine the appropriate amount of risk for each of our clients to take in their investment portfolios. We then manage the portfolio taking into account macroeconomic developments and the price action of the market itself. By doing so, we hope to create a risk and return profile that is suitable for each of our very unique clients.
Finally, I would like to wish everyone a healthy and prosperous New Year. Thank you to all of our clients for their continued support.
Sincerely,

Jonathan R. Heagle
President and CIO
OVERALL MARKET COMMENTARY
2019 was a year when everything worked. As fears of a recession eroded and the salve of accommodative monetary policy kicked in, equities soared to new highs and generated terrific returns. At the same time, fixed income, which is usually held for its income and stable return profile, also produced strong returns as the Federal Reserve began to cut interest rates and the bond bears threw in the towel.
SPY (S&P 500 ETF) ended the year with a 31% total return and AGG (US Aggregate Bond ETF) generated an 8.5% return. These types of returns are to be celebrated, but not expected. As we look forward from 2020, we must ratchet our future return expectations down. With the 10-year treasury yielding 1.9% to end the year, it will be hard for fixed income to generate such strong returns without a slowdown of the economy and/or a sentiment shift to risk aversion. Either of those scenarios would unlikely be positive for the equity market.
Heading into 2020, there are a number of factors that put the wind at the market’s back. First, the Federal Reserve’s rate cuts appear to have stemmed the economic weakness that was pervasive in 2019. Second, the tone of the trade negotiations between the U.S. and China have become much more constructive. While no blockbuster deal has been announced, the negotiations are moving in the right direction. Finally, with the U.S. election is far enough away that it is not an immediate concern and the Trump administration is likely to be very cognizant of stock market returns in advance of the U.S. election in November.
EQUITY MARKET
Figure 1: Equity Index ETF Returns
| ETF | Description | Q4 2019 Total Return | 2019 Total Return |
| SPY | S&P 500 | 9.0% | 31.2% |
| QQQ | Nasdaq 100 | 12.8% | 39.0% |
| IWM | Russell 2000 | 9.9% | 25.4% |
| IVW | S&P 500 Growth | 8.2% | 30.8% |
| IVE | S&P 500 Value | 9.8% | 31.6% |
| VXUS | International Ex-US | 9.0% | 21.7% |
| IEMG | Emerging Markets | 12.2% | 17.8% |
After a choppy 2nd and 3rd quarter, equities found a footing in the 4th quarter and delivered excellent returns. SPY (S&P 500 ETF) closed the year with a total return of 31.2%, while QQQ (Nasdaq 100 ETF) returned an eye popping 39%. These types of returns are a reminder of why it is important to stay disciplined during market corrections.
Small capitalization stocks outperformed large capitalization stocks in the 4th quarter, but still lagged for the year. IWM (Russell 2000 ETF) returned 25.4% in 2019, lagging the SPY (S&P 500 ETF) by almost 6%.
IVE (S&P 500 Value) had a strong 4th quarter with a 9.8% total return, resulting in a full year return of 31.6%. IVW (S&P 500 Growth) underperformed by 1.7% in the 4th quarter and by 0.8% for the full year.
While International markets performed well, with VXUS (International ETF) and IEMG (Emerging Market ETF) up 21.7% and 17.8% for 2019, respectively, they lagged U.S. equity markets once again. Despite underperforming SPY (S&P 500 ETF) and VXUS (International ETF), by a healthy margin, it should be noted that IEMG (Emerging Markets ETF) outperformed the other indices in the 4th quarter by over 3%. This is largely due to the narrative around trade, but could also reflect an acknowledgement by asset managers that emerging market stocks are more attractively valued that domestic stocks.
Since the 2nd quarter of 2019, we were pretty defensively positioned with an underweight position in equities and healthy cash allocation. We were also generally overweight defensive sectors, such as Utilities and Consumer Staples. During the 4th quarter we trimmed cash balances and increased growth-oriented sector allocations where appropriate.
We believe that equities will be well supported in early 2020. We see potential for emerging markets to outperform domestic markets as they play catch up. This sanguine view becomes challenged as we approach the midpoint of the year and the U.S. Presidential election.
Figure 2: Equity Sector Returns
| ETF | Description | Q4 2019 Total Return | 2019 Total Return | |
| XLV | Healthcare | 14.2% | 20.5% | |
| XLK | Technology | 14.2% | 49.9% | |
| XLF | Financials | 10.5% | 31.9% | |
| XLB | Materials | 6.1% | 24.1% | |
| XLE | Energy | 5.5% | 11.7% | |
| XLI | Industrials | 5.5% | 29.1% | |
| XLY | Consumer Disc | 4.3% | 28.4% | |
| XLP | Consumer Staples | 3.4% | 27.4% | |
| IYZ | Telecom | 3.1% | 16.1% | |
| XLU | Utilities | 0.6% | 25.9% |
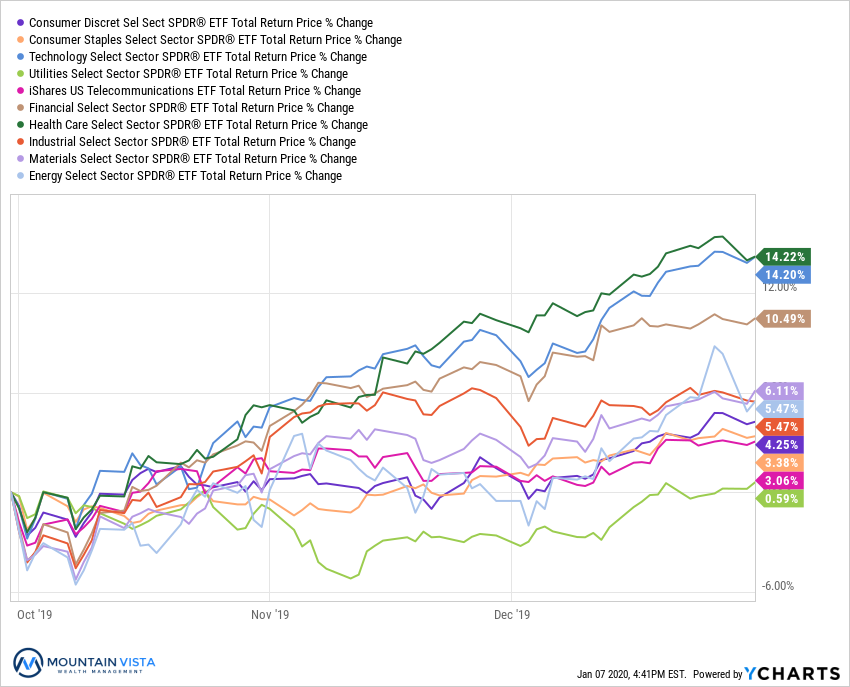
XLV (Healthcare ETF) and XLK (Technology ETF) were the top performing sectors in the 4th quarter each with a total return of 14.2%. XLF (Financials ETF) generated a market beating return of 10.5%. Healthcare stocks were buoyed by the perceived decrease in political risk heading into the presidential election. XLK and XLF benefited as investors ratcheted up their future growth expectations.
XLU (Utilities Sector ETF), IYZ (Telecom ETF) and XLP (Consumer Staples ETF) were the laggards with total returns of 0.6%, 3.1% and 3.4%, respectively. With investors anticipating a pick-up in growth prospects, increasing long-term interest rates and their outperformance earlier in the year, it came as no surprise that these defensive sectors underperformed.
For the calendar year 2019, XLK (Technology ETF) was the far-and-away top performing sector with a total return of 49.9%. XLF (Financial ETF), XLI (Industrials ETF) and XLY (Consumer Discretionary ETF) produced returns of 31.9%, 29.1% and 28.4%, respectively. With the U.S. avoiding a recession and the shift in monetary policy, these growth-oriented, economically sensitive sectors performed very well.
During the 4th quarter, we reduced our exposure to defensive sectors as the prospects of recession fade heading into 2020. As the year progresses, it is likely that we will have to reassess that view to position for potential volatility around the U.S. election in November.
Figure 3: Equity Sector Quarterly Total Return
FIXED INCOME MARKET
Figure 4: Fixed Income Returns
| ETF | Description | Q4 2019 Total Return | 2019 Total Return | |
| AGG | Aggregate Bond | 0.1% | 8.5% | |
| BND | Total Bond Market | 0.2% | 8.8% | |
| LQD | IG Corporate | 1.5% | 17.4% | |
| JNK | HY Corporate | 2.5% | 14.9% | |
| EMB | $ EM Bonds | 2.6% | 15.5% | |
| SHY | 1-3 Yr Treasuries | 0.4% | 3.4% | |
| IEF | 7-10 Yr Treasuries | (1.4%) | 8.0% | |
| TLT | 20+ Yr Treasuries | (4.7%) | 14.1% | |
| TIP | TIPs | 0.6% | 8.3% |
In the 4th quarter, fixed income results were mixed. Long duration treasuries lost ground as the prospects for higher economic growth pushed yields higher. The yield on 10-year U.S. treasury bonds increased 24 bps from 1.68% to 1.92% over the quarter. The increase in long-term yields caused TLT (20+ year US Treasury ETF) to lose (4.7%).
In contrast to risk-free U.S. treasuries, credit sensitive bonds managed to post gains over the quarter, as credit spreads tightened to reflect stronger growth expectations. EMB (Dollar EM Bond ETF) and JNK (High Yield Corporate Bond ETF) were the top performers with total returns of 2.6% and 2.5%, respectively. AGG (Barclays Aggregate Fixed Income ETF) and BND (Pimco Total U.S. Bond ETF) were essentially flat in the 4th quarter.
The calendar year 2019 was very good to fixed income. Lower growth and inflation expectations, as well as a change of course by the Federal Reserve, pushed yields lower and the avoidance of an outright recession allowed credit spreads to tighten. LQD (Investment Grade Corporate ETF) was the top performer with a total return of 17.4%. EMB (Dollar EM Bond ETF), JNK (High Yield Corporate Bond ETF) and TLT (20+ Year U.S. Treasury ETF) generated 14-15% returns.
Looking forward to 2020, it is unlikely that fixed income will produce similar returns, but it remains an important hedge against a deflationary environment and provides diversification from equities. Credit spreads should be well supported as we enter 2020, with a recession unlikely to occur in the near-term.
Figure 5: U.S. Treasury Yields
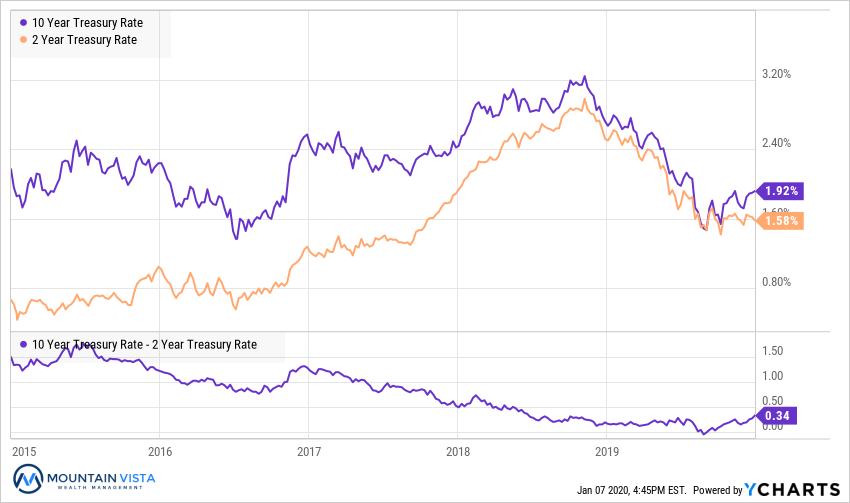
While the 10-year treasury rate dropped 77 bps year-over-year, it has climbed 45 bps since reaching its low point of 1.47% in September, ending the year at 1.92%. Also, of note is that spread between the 2-year and 10-year treasury rate ended the year at +34 bps. Towards the end of August, the spread bottomed at (-4 bps). This spread is a popular recession indicator, so we are glad to see the spread rebound strongly to the upside. The steepening of the yield curve supports our view that economic activity is likely to remain stable heading into 2020.
We don’t expect the Federal Reserve to make any dramatic moves in an election year, so the bar will be higher than usual for additional monetary policy actions.
Figure 6: U.S. Corporate Credit Spreads
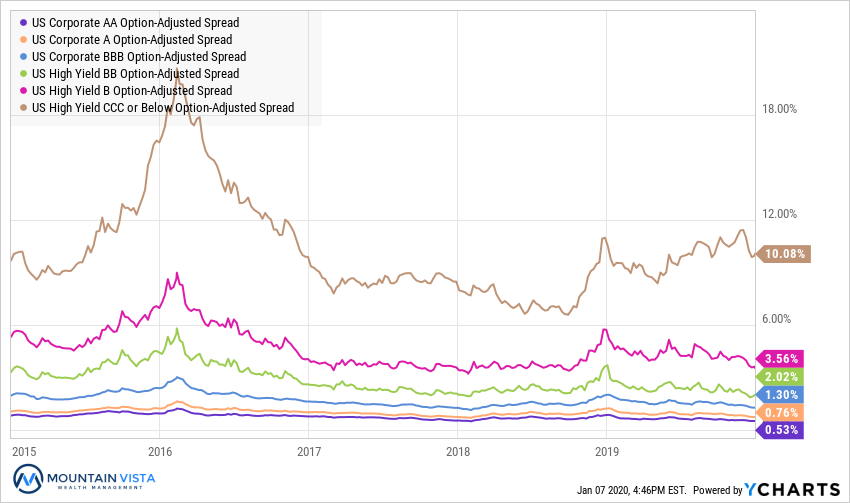
Corporate credit had a strong finish to 2019 with spreads tightening across the rating spectrum. B-rated bonds tightened by 59 bps, while AA-rated bonds were tighter by 9 bps. In percentage terms A-rated bonds tightened the most, with their spread dropping by 19% over the quarter.
Most importantly, spreads of CCC-rated bonds began to fall during December, after steadily rising since May. This further reinforces our view that the economy is on a better footing heading into 2020. We will continue to monitor this sector for any change in trend, but we would expect CCC-rated spreads to continue to tighten as concerns of a recession diminish.
CONCLUSION
With both equites and fixed income producing strong annual gains over the last 12 months, it is easy to grow complacent, chase returns and increase risk. This is one of the behaviors that creates boom and bust cycles in the market. For those that participate in this behavior, the result is poor returns and endless frustration. We avoid this pitfall by staying true to our long-term asset allocation and rebalancing periodically.
Remember it was only a year ago that the S&P 500 fell by nearly 20% over the course of two months. Corrections, defined as a drop of at least 10%, occur every 1-2 years on average. It is during these periods, when it is most uncomfortable, that we should be increasing our risk exposure.
As we enter 2020, the outlook for equities looks promising. There are very few obvious reasons to be concerned about economic growth or monetary policy in the first half of the year. As we approach the U.S. presidential election, it is more difficult to predict how markets will react. Also, SPY (S&P 500 ETF) is up over 11% since October 9th, so at least some of this viewpoint has been priced in.
Happy New Year and we wish you a healthy and prosperous 2020!
Disclaimer
The views and opinions expressed are for informational and educational purposes only as of the date of writing and may change at any time based on market or other conditions and may not come to pass. This material is not intended to be relied upon as investment advice or recommendations, does not constitute a solicitation to buy or sell securities and should not be considered specific legal, investment or tax advice. The information provided does not take into account the specific objectives, financial situation, or particular needs of any specific person. All investments carry a certain degree of risk and there is no assurance that an investment will provide positive performance over any period of time. Equity investments are subject to market risk or the risk that stocks will decline in response to such factors as adverse company news or industry developments or a general economic decline. Debt or fixed income securities are subject to market risk, credit risk, interest rate risk, call risk, tax risk, political and economic risk, and income risk. As interest rates rise, bond prices fall. Non-investment-grade bonds involve heightened credit risk, liquidity risk, and potential for default. Foreign investing involves additional risks, including currency fluctuation, political and economic instability, lack of liquidity and differing legal and accounting standards. These risks are magnified in emerging markets. Past performance is no guarantee of future results.