
INTRODUCTION
“Far more money has been lost by investors … trying to anticipate corrections than has been lost in corrections themselves.” -Peter Lynch
As we turn the page on 2021, I cannot help but reflect on the events of the past year. In doing so, I am always reminded of how these events, in the moment, seem monumental, but ultimately fade away as we turn our attention to the next issue du jour. While the financial media experienced numerous panics throughout the year, the S&P 500 suffered no more than a 5% decline over the course of 2021, highlighting the importance of having a long-term view and looking through the short-term noise.
Today, the market’s attention is on inflation and the removal of accommodative policies by the Federal Reserve. As you are bombarded with hyperbolic and anecdotal claims of hyperinflation or a looming market crash, take comfort in the fact that no one is incentivized to achieve these outcomes. Politicians need to be re-elected, Federal Reserve board members want to be reappointed and companies primarily exist to make a profit. It may take some time, but policies will adjust, and the market will too.
Being a long-term investor does not mean that you should ignore the shifting sands. Your portfolio should adapt to the environment to improve its risk and return profile. We are constantly reviewing our holdings and looking for opportunities to capitalize on changes in the market and the economy.
We deeply appreciate your confidence and will continue to work tirelessly to improve your financial future. Happy holidays from the team at Mountain Vista!
Sincerely,

Jonathan R. Heagle, CFP®, CFA
President and Chief Investment Officer
OVERALL MARKET COMMENTARY
The stock market ended 2021 with another banner year. The S&P 500 and Nasdaq 100 clocked total returns of 28.7% and 27.4%, respectively, making 2021 the third straight year of double-digit growth. The results are made all the more impressive, when you consider that the world has been significantly impacted by a global pandemic for two of the three years.
Despite the impressive returns, most investors are anything but complacent. For every conversation I have about achieving higher returns, I have one about the next market crash. That being said, speculative bubbles have percolated in corners of the market. Think SPACs, spikes in newly issued stocks, high-growth technology stocks and “MEME stocks”. These baby bubbles have largely deflated, while the broader market continued to move higher, unscathed.
One of the biggest surprises of 2021 has been the resiliency of long-term interest rates. If you were to tell me on January 1st that the CPI would end the year at 6.8% and 3rd quarter Real GDP growth would be almost 5%, I would never have guessed that the 10-year treasury yield was 1.5%. While there are a variety of demographic and technical reasons why long-term treasuries remain well supported, the market is still betting that inflation is transitory, even if the Federal Reserve has changed its tune. With inflation peaking and GDP growth rates expected to fall in 2022, the path to significantly higher rates may be challenging.
The Re-Birth of Inflation
A key characteristic of the post “credit crisis” recovery has been persistently low inflation. With the exception of 2011, the Federal Reserve consistently missed their 2% inflation target to the downside. This all changed in 2021. The combination of supply-chain disruptions, a hesitant workforce and coordinated fiscal and monetary stimulus created an inflationary environment that we have not seen for decades.
Figure 1: U.S. CPI and PCE Indices
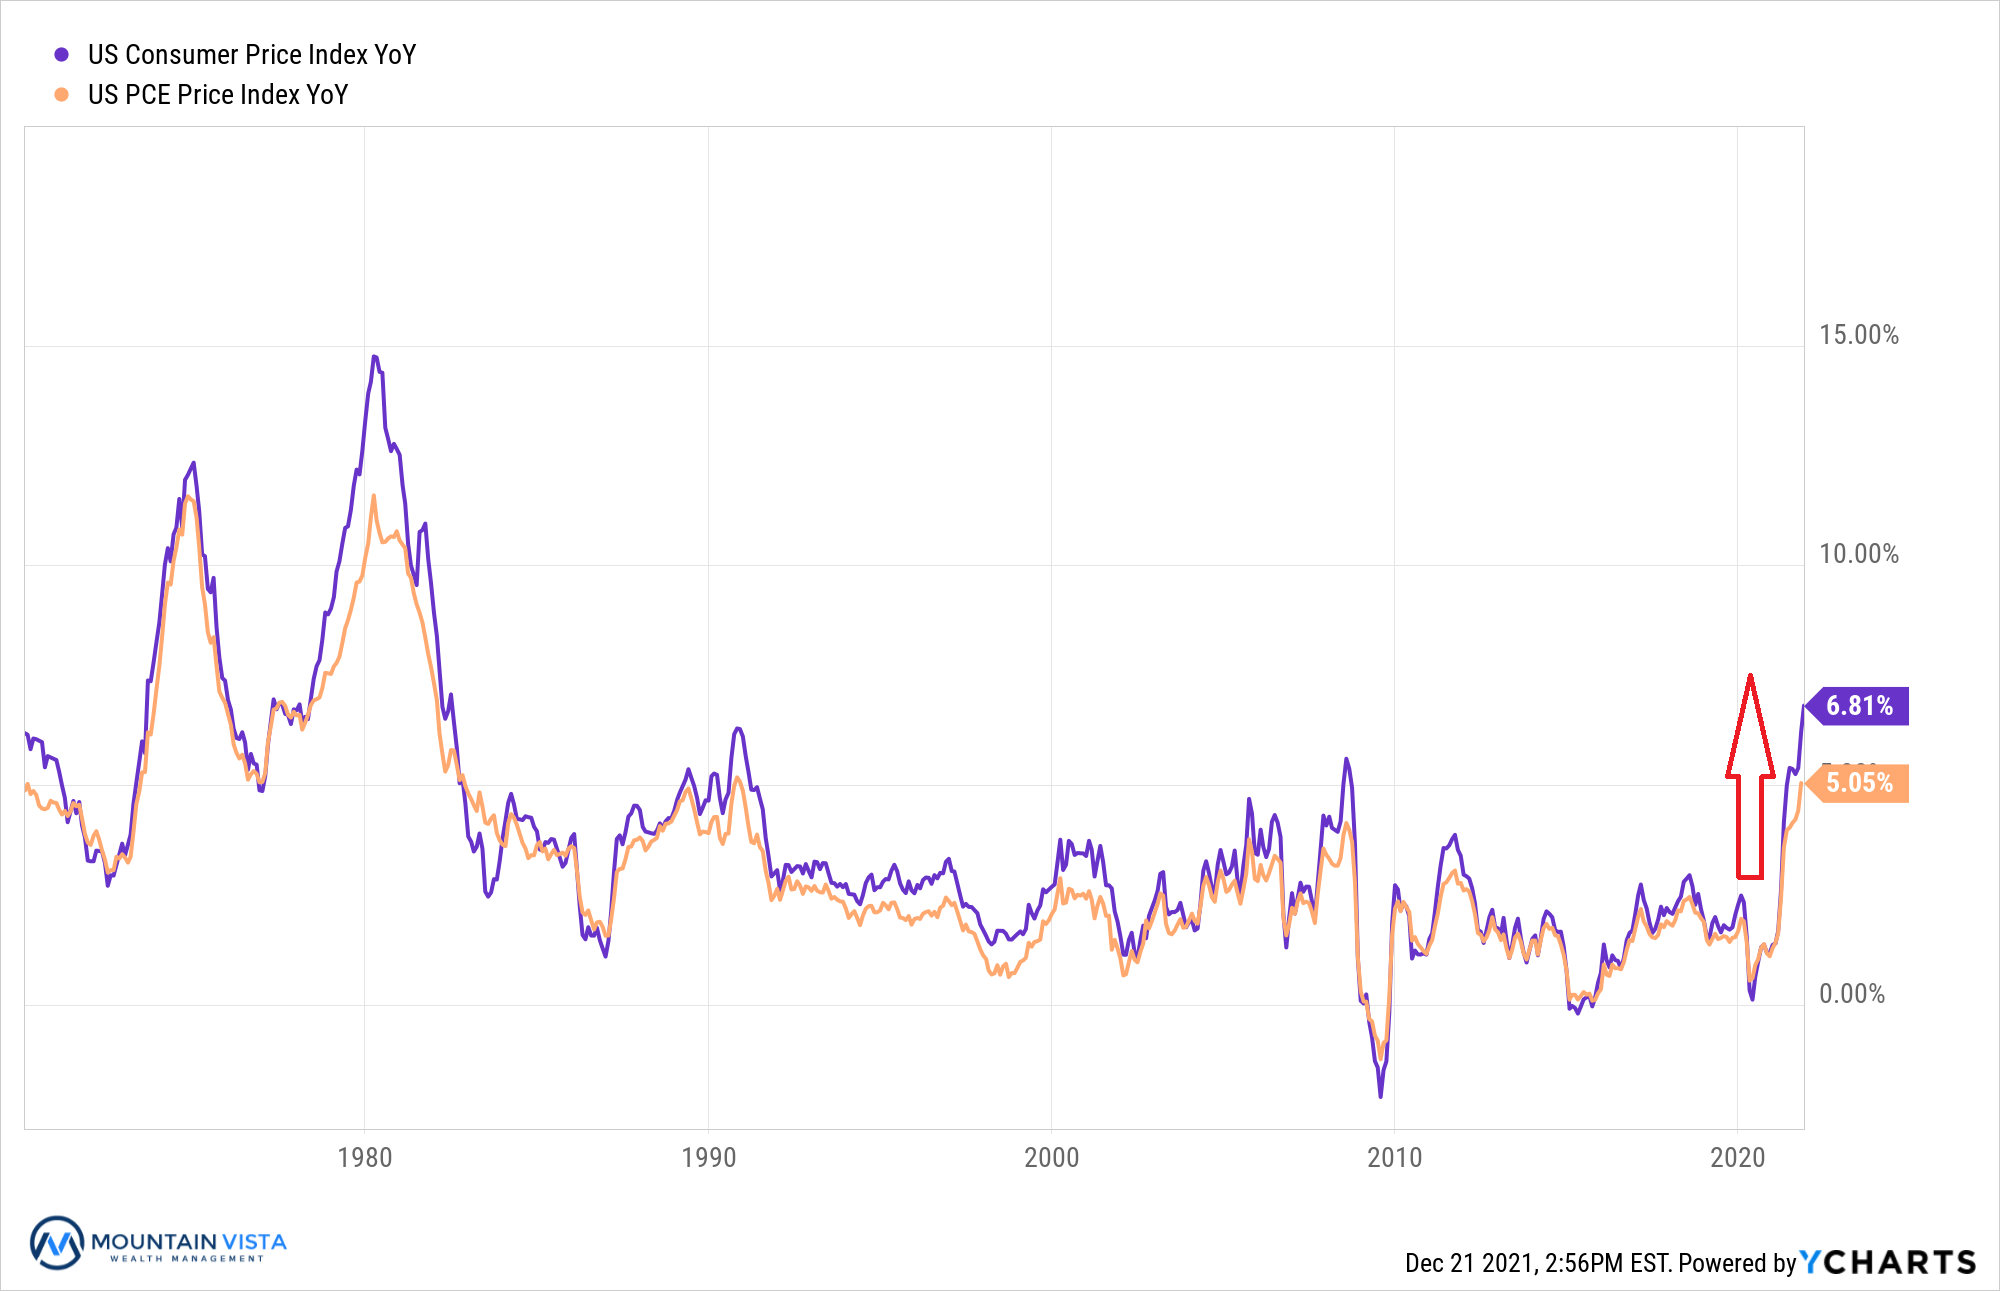
While key components of CPI, namely Gasoline (+58%), Oil (+59%) and Used Cars (+31%), are growing at unsustainable rates, almost all components of the index show year-over-year increases in the mid-single digits, far exceeding the Federal Reserve’s 2% target.
Figure 2: Consumer Price Index by Component since 2000
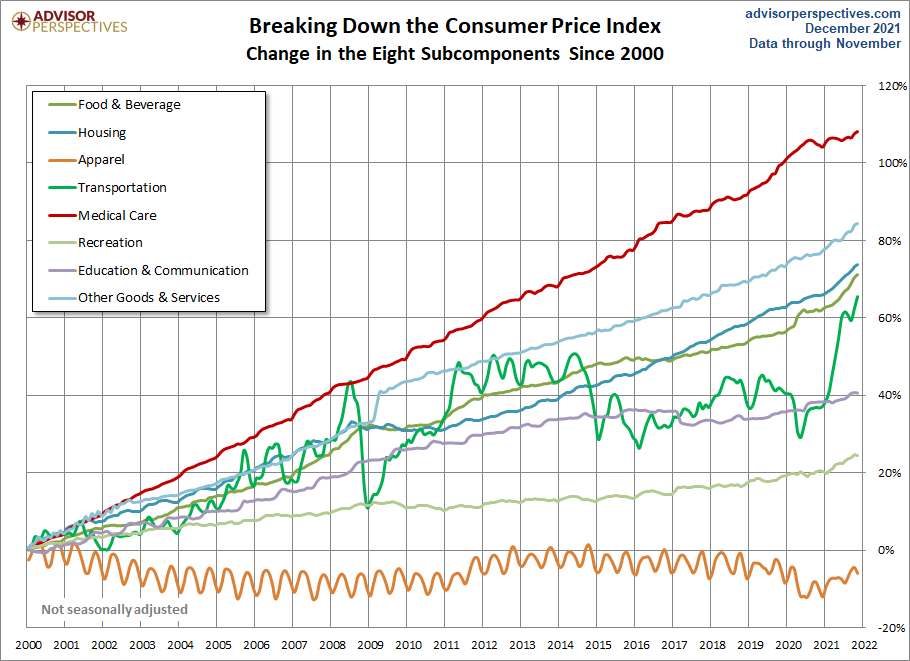
In Figure 2, you can see the large move higher in Transportation, which includes gasoline and automobiles. If the large price gains were isolated to this category, then the “transitory” narrative would still be alive. Looking more closely though, you can see prices gains accelerating across all categories, except for Apparel and Medical Care, over the course of 2021.
Figure 3: Consumer Price Index Components
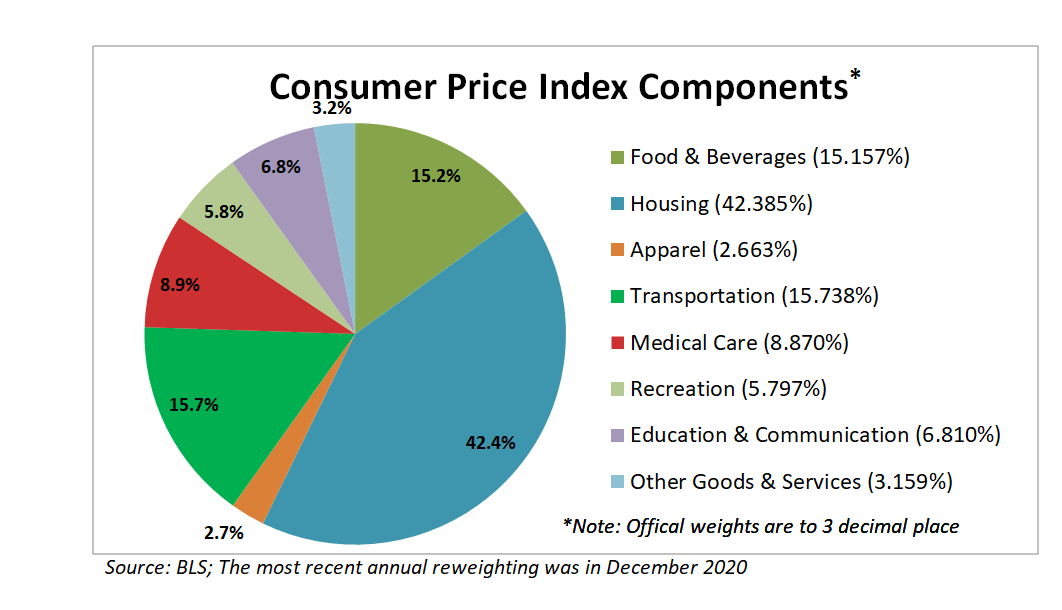
In Figure 3, you can see the contribution of each category to the overall index level. Note that Housing is weighted over 40% and is more closely tied to rental inflation than headline price indices. Most economists expect rental inflation to remain above trend for the foreseeable future as the economy remains strong and buyers are priced out of purchasing a home. Persistently strong rental inflation will put a high floor under CPI.
The Fed’s shift towards a more urgent removal of accommodation will help inflation directionally, but their policies cannot make workers take low-paying jobs or fix supply-chain issues. For these inflationary forces to subside, we need COVID to become less influential on our daily lives.
The Bear Within the Bull Market
In 2021, the S&P 500 clocked its third consecutive year of double-digit gains, ending 2021 with a total return of 28.7%. All is well, right? Despite the strength of the S&P 500, many corners of the equity market suffered a different fate. As many a day trader has said before, it’s a market of stocks, not a stock market. In 2021, the S&P 500 owned the right stocks due to its market capitalization-based weighting methodology and the outperformance of the largest technology companies.
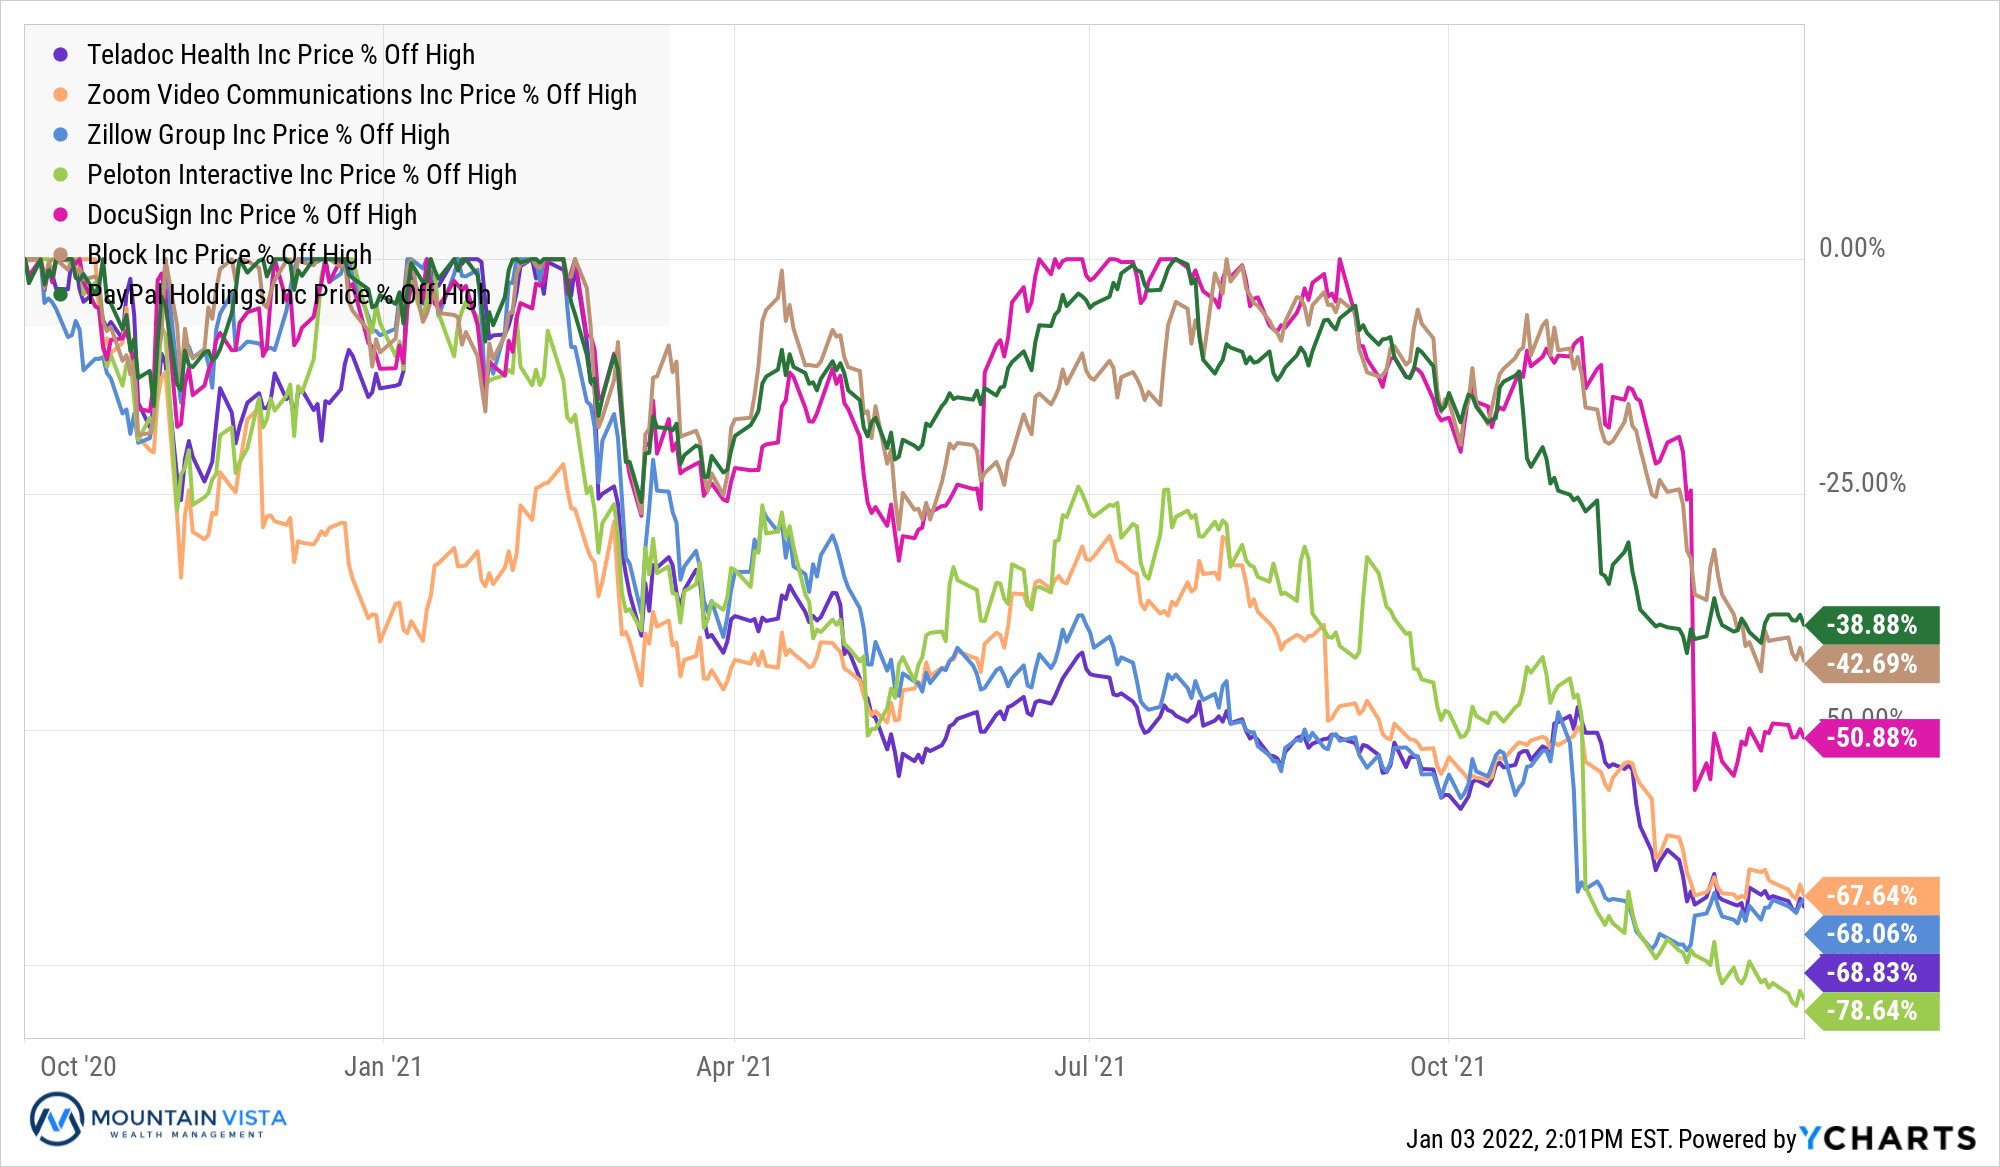
First, consider the “stay-at-home” stocks and other COVID beneficiaries that performed well in 2020. Zoom peaked in October 2020, but the rest of the group fell apart in February 2021. The common characteristic of these stocks is that they experienced tremendous growth in 2020 and reached very high valuation multiples. As consumers behavior shifted over the course of 2021, interest rates increased and their sales growth came back down to Earth, so did their stock prices.
Figure 4: Select High Growth and COVID Beneficiary Stock Drawdowns
While the “stay-at-home” stocks saw the most dramatic declines, most high-growth, innovation stocks also came under pressure in the latter part of 2021. Consider ARKK (Ark Innovation ETF), which is run by 2020’s superstar manager, Cathie Wood. It ended the year down (-39.6%) from its high in February, despite its largest holding, TSLA, returning north of 50% in 2021! While it may seem like a great time to buy these “beaten-down” stocks, ARKK is still up almost 100% since the beginning of 2020. It can get worse before it gets better.
Next, consider the performance of newly issued companies. While the volume of equity issuance reached record levels in 2021, the prices of many initial public offerings (IPOs) are far from their peak levels. In 2021, many high-profile IPOs hit the market with eye-popping first day gains, only to see price declines in the following weeks and months. After peaking in February, IPO (Renaissance IPO ETF) has fallen (-24.0%).
Finally, SPACs, which saw tremendous issuance in 2020 and the 1st quarter of 2021, have plummeted since their early 2021 high. SPAK (Defiance Next Gen SPAC ETF) closed the year down (-39.2%) from its peak. As a reminder, SPACs are “blank check” companies that provide an alternative path for companies looking to go public. We discussed SPACs in detail in our Q1 2021 Investment Letter.
Figure 5: SPAC and IPO drawdowns
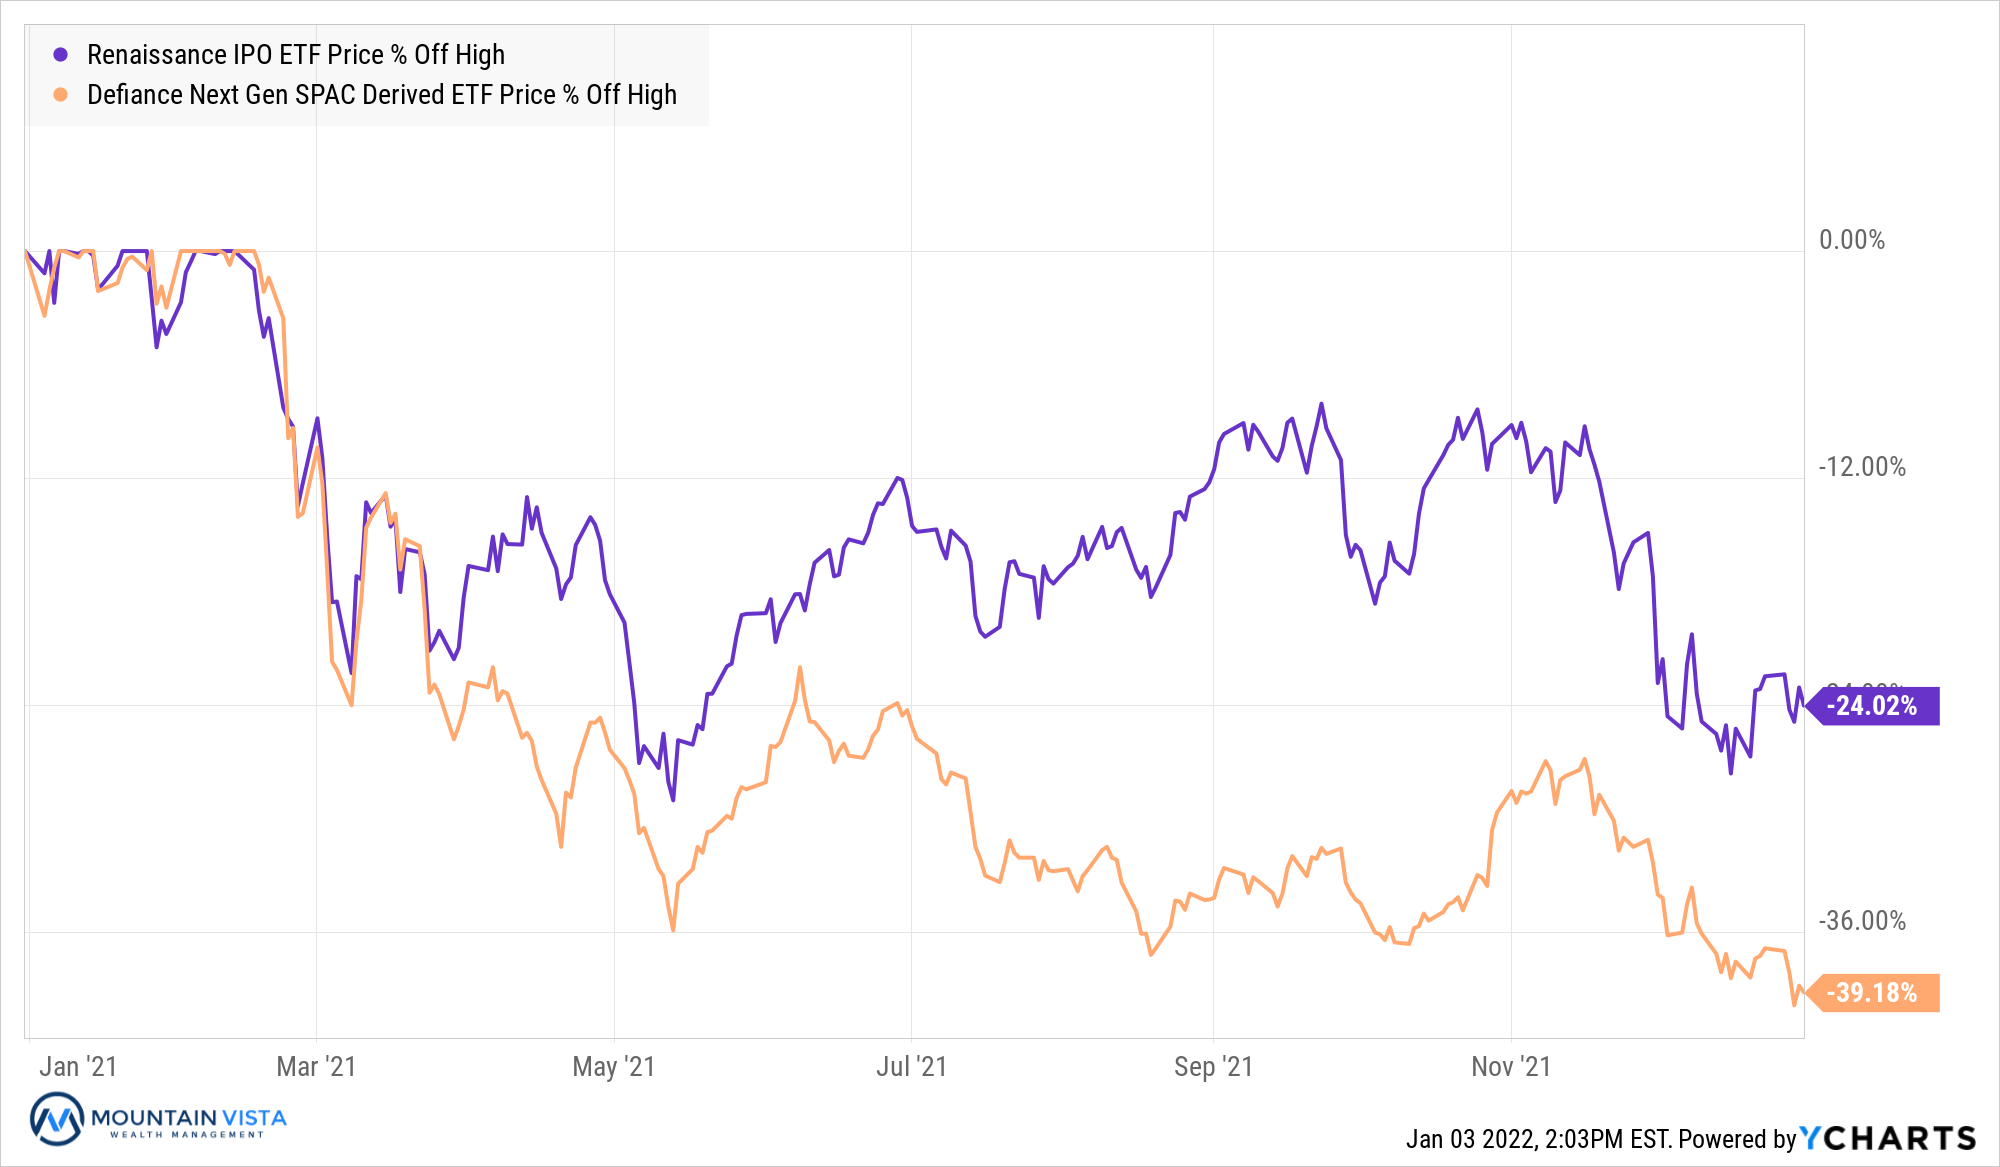
The underperformance of these niche corners of the market is important, because retail investors tend to own an outsized allocation to these companies. They are exciting companies with a great story, but they have a lot to prove before fundamentals can justify the valuations.
Much has been made of a new generation of investors entering the market over the last two years. At a high level, this trend is a positive for both capital creation and the long-term wealth prospects of those individuals, but it appears that the Robinhood crowd is learning an expensive lesson about valuation and speculation.
While the retail crowd likely suffered the most, active fund managers also continue to struggle against their benchmarks. In 2020, a year commonly touted as a “stock-pickers market”, Morningstar reported that only 49% of the ~3,500 active funds tracked beat their respective benchmarks. The number fell to 47% for the 12 months through June 2021. Given the trends discussed above, it is unlikely that active managers fared much better in the final six months of the year.
EQUITY MARKET
Figure 6: Equity Index ETF Returns
| ETF | Description | Q4 2021 Total Return | 2021 YTD Total Return |
| SPY | S&P 500 | 11.1% | 28.7% |
| QQQ | Nasdaq 100 | 11.3% | 27.4% |
| IWM | Russell 2000 | 2.0% | 14.5% |
| IVW | S&P 500 Growth | 13.3% | 31.8% |
| IVE | S&P 500 Value | 8.2% | 24.7% |
| VXUS | International Ex-US | 2.0% | 9.0% |
| IEMG | Emerging Markets | (0.9%) | (0.6%) |
Most U.S. equity indices had a strong 4th quarter with SPY (S&P 500 ETF) and QQQ (Nasdaq 100 ETF) finishing the year at their highs and returning 28.7% and 27.4%, respectively. Both indices experienced volatility in November and early December, but SPY and QQQ rallied meaningfully in the final two weeks of the year, building upon their October gains and generating quarterly returns of 11.1% and 11.3%, respectively.
Small capitalization stocks continued to struggle, relative to large capitalization stocks. In October it looked like IWM (Russell 2000 ETF) was breaking out of its recent trading range, but November’s volatility brought IWM back towards the low end of the range, resulting in a failed breakout. IWM gained 2.0% in the 4th quarter and returned 14.5% year-to-date.
Growth stocks outperformed Value stocks by 5.1% in the 4th quarter. As concerns about higher interest rates subsided, large technology stocks reestablished their dominance. IVE (S&P 500 Value ETF) and IVW (S&P 500 Growth ETF) generated quarterly returns of 8.2% and 13.3%, respectively. With economic growth and inflation poised to cool down in 2022, the headwinds faced by large technology stocks during 2021 may be coming to an end.
International equities and emerging markets equities underperformed U.S. Equities. In the 4th quarter, VXUS (International ETF) returned 2.0% and IEMG (Emerging Market ETF) declined (-0.9%). Their full-year returns were 9.0% and (-0.6%), respectively. The underperformance of international and emerging markets has been consistent and frustrating. That being said, a large portion of the S&P 500’s outperformance is due to the success of top 6 stocks (AAPL, MSFT, AMZN, GOOGL, TSLA, FB).
Looking forward to 2022, we expect another year of positive returns in the equity market, driven by a lack of alternatives in a world of low rates, reasonable GDP growth and cooler inflation expectations. That being said, we would not be surprised to see increased volatility and, potentially, a correction in the first half of the year, as the market digests rate hikes and prepares for the mid-term elections.
Figure 7: Equity Sector Returns
| ETF | Description | Q4 2021 Total Return | 2021 YTD Total Return |
| XLRE | Real Estate | 17.6% | 46.1% |
| XLK | Technology | 16.7% | 34.7% |
| XLB | Materials | 15.1% | 27.4% |
| XLY | Consumer Disc | 14.1% | 27.9% |
| XLU | Utilities | 12.9% | 17.7% |
| XLP | Consumer Staples | 12.8% | 17.2% |
| XLV | Healthcare | 11.1% | 26.0% |
| XLI | Industrials | 8.6% | 21.1% |
| XLE | Energy | 7.9% | 53.3% |
| XLF | Financials | 4.5% | 34.8% |
| IYZ | Telecom | 1.7% | 11.7% |
| XLC | Communications | (2.8%) | 16.0% |
In the 4th quarter, XLRE (Real Estate Sector ETF) and XLK (Technology Sector ETF) were the top performing industry ETFs, with returns of 17.6% and 16.7%, respectively. On a year-to-date basis, XLE (Energy Sector ETF) took the top spot with an impressive return of 53.3%.
XLC (Communications Sector ETF) and IYZ (Telecom Sector ETF) were the laggards with 4th quarter returns of (-2.8%) and 1.7%, respectively. Overall cyclical sectors underperformed the index, while defensive and higher duration sectors outperformed.
Over the 4th quarter, we simplified the portfolio and enter 2022 with a tilt towards value and a small overweight in financials. This positioning reflects our concerns about a potential pullback in early 2022. Given our positive full year outlook, this should present a buying opportunity.
Figure 8: Equity Sector Quarterly Total Return

FIXED INCOME MARKET
Figure 9: Fixed Income Returns
| ETF | Description | Q4 2021 Total Return | 2021 YTD Total Return |
| AGG | Aggregate Bond | (0.1%) | (1.8%) |
| BND | Total Bond Market | (0.0%) | (1.9%) |
| LQD | IG Corporate | 0.4% | (1.8%) |
| JNK | HY Corporate | 0.7% | 4.0% |
| EMB | $ EM Bonds | 0.4% | (2.2%) |
| SHY | 1-3 Yr Treasuries | (0.6%) | (0.7%) |
| IEF | 7-10 Yr Treasuries | 0.1% | (3.3%) |
| TLT | 20+ Yr Treasuries | 3.2% | (4.6%) |
| TIP | TIPs | 2.4% | 5.7% |
Over the 4th quarter, the yield on 2-year U.S. Treasury bonds increased 45 bps, from 0.28% to 0.73%, as the market began to price in rate hikes in 2022 and beyond. The yield on 10-year U.S. Treasury bonds was relatively stable over the quarter.
TLT (20+ Year U.S. Treasury ETF) and TIP (U.S. Treasury Inflation Protected ETF) returned 3.2% and 2.4%, respectively, in the 4th quarter. For the full calendar year, TIP and JNK (High Yield Bond ETF) returned 5.7% and 4.0%, respectively, topping the list of fixed income ETFs in a sea of red.
EMB (Emerging Market Dollar Bond ETF) returned 0.4% in the 4th quarter and (-2.2%) year-to-date. Emerging Market bonds continue to be pressured by dollar strength and a shifting Federal Reserve policy.
We remain underweight fixed income, in favor of cash, but are growing increasingly skeptical that the 10-year U.S. Treasury will be able to reach 2% in 2022. We expect economic growth and inflation to cool over the course of 2022, relieving some of the pressure on the Federal Reserve to hike the Federal Funds rate too aggressively. Also, any stock market volatility will likely result in lower yields due to a flight to safety.
Figure 10: U.S. Treasury Yields
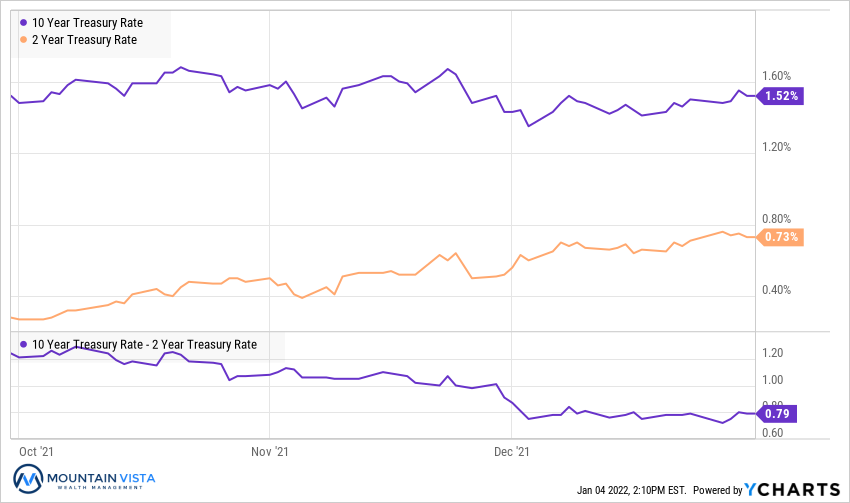
The U.S. Treasury curve continued to flatten in the 4th quarter, as the yield on 2-year U.S. Treasury bonds increased 45 bps, while the yield on 10-year U.S. Treasury bonds was relatively stable. This resulted in a 45 bps drop in the spread between 2’s and 10’s.
We will be watching the steepness of the curve as we approach the end of quantitative easing. As we mentioned in the 3rd quarter investment letter, long-term yields tend to fall as the Federal Reserve ends QE, while the spread between 2s and 10s falls. While the 10-year yield has not fallen much, the curve has flattened materially. This indicates that medium and long-term inflation and growth expectations remain subdued.
Figure 11: U.S. Corporate Credit Spreads
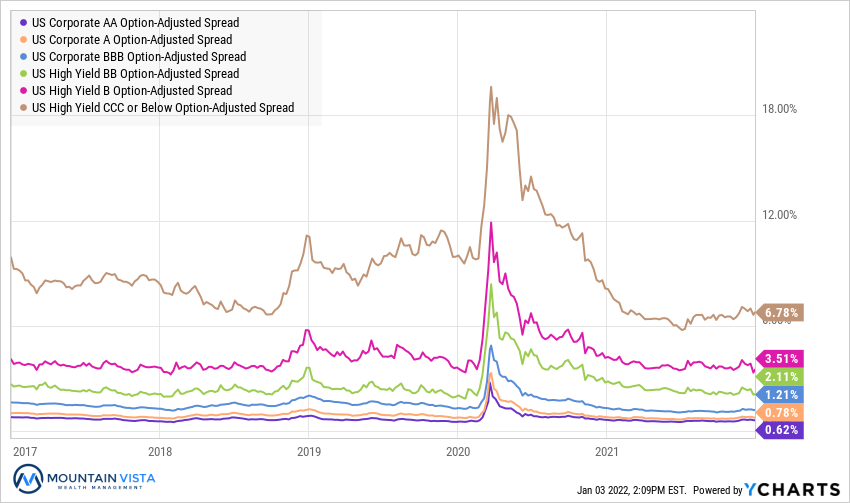
Corporate credit spreads were mixed over the course of the 4th quarter and experienced a bit of volatility in November. At a high level, credit spreads remain very tight and do not display much concern about the economy or credit.
CCC-rated and AA-rated bond spreads widened by 24 bps and 7 bps, respectively over the 4th quarter, while BB-rated and B-rated bonds tightened by 7 bps and 13 bps.
Credit markets continue to be very well behaved. Should we see spreads on lower rated bonds widening, we will be more concerned about a material and lasting correction in equities.
CONCLUSION
The S&P 500 ended 2021 at its year-to-date high, generating a total return of almost 30%. This is after returns of 18% and 31% in 2020 and 2019, respectively. Historically, after three consecutive years of double-digit gains, the S&P 500 has not had very strong returns. According to DataTrek Research, the S&P 500 has had three consecutive double-digit returns 9 times in the past. Four times out of 9 the S&P 500 has fallen in the fourth year.
Does that mean we should throw in the towel and sell everything? Of course not. The market was up the other 5 times and averaged 25% returns! It does mean that we should continue to closely monitor the market for risks and opportunities, while staying true to our long-term asset allocations.
Thank you to our clients for your continued support of Mountain Vista. We wish you a happy and healthy 2022!
Sincerely,
Jonathan R. Heagle, CFP®, CFA
President and Chief Investment Officer
Disclaimer
The views and opinions expressed are for informational and educational purposes only as of the date of writing and may change at any time based on market or other conditions and may not come to pass. This material is not intended to be relied upon as investment advice or recommendations, does not constitute a solicitation to buy or sell securities and should not be considered specific legal, investment or tax advice. The information provided does not take into account the specific objectives, financial situation, or particular needs of any specific person. All investments carry a certain degree of risk and there is no assurance that an investment will provide positive performance over any period of time. Equity investments are subject to market risk or the risk that stocks will decline in response to such factors as adverse company news or industry developments or a general economic decline. Debt or fixed income securities are subject to market risk, credit risk, interest rate risk, call risk, tax risk, political and economic risk, and income risk. As interest rates rise, bond prices fall. Non-investment-grade bonds involve heightened credit risk, liquidity risk, and potential for default. Foreign investing involves additional risks, including currency fluctuation, political and economic instability, lack of liquidity and differing legal and accounting standards. These risks are magnified in emerging markets. Past performance is no guarantee of future results.