
INTRODUCTION
“Invest for the long haul. Don’t get too greedy and don’t get too scared”
– Shelby M.C. Davis
As we enter 2025, let us take a moment to reflect on the truly amazing investment period that we have just lived through. The S&P 500 and Nasdaq 100 delivered total returns of ~25% in 2024, following gains of 26% and 54% in 2023 – culminating in two-year returns of 58% and 92%, respectively.
Now that we are feeling good, we should reflect on the conditions that set up such tremendous gains. 2022 was one of the most difficult investment periods of my career. The S&P 500 lost (-19%) over the year (with a peak draw down of (-25%) from its 2021 high) and the Nasdaq 100 lost a third of its value over the year. Even bonds offered little shelter, with the Bloomberg U.S. Aggregate bond index losing(-13%), including dividends, and suffering a peak loss of (-17%).
Looking ahead, we are very unlikely to experience equity returns like the last two years over the next two years. The forward Price/Earnings Ratio of the S&P 500 reached ~23x in December, rivalling levels seen in 2000 and 2021. That does not mean that a crash is imminent, but it suggests more modest returns ahead.
Markets move in cycles, and just as we counseled against fear in 2022, we now advise against excessive optimism. Now is a great time to revisit your risk tolerance and make sure you can survive the next correction.
Thank you to our amazing clients for trusting us to help you secure your retirement for another year! If you have any questions about anything in this letter, do not hesitate to reach out to your advisor.
Sincerely,
Jonathan R. Heagle, CFP®, CFA
President and Chief Investment Officer
QUARTERLY ROUNDUP
Market Performance Overview
The stock indices capped off a second consecutive year of strong gains with a positive 4th quarter. The S&P 500 returned 2.5% and the Nasdaq 100 was up 4.9% in Q4, bringing their annual tally to 24.9% and 25.6%, respectively. These 2024 gains were particularly notable as they built upon robust 2023 performance, leading to exceptional two-year total returns of 58% for the S&P 500 and 92% for the Nasdaq 100. Investors who remained patient during 2022 were handsomely rewarded.
Figure 1: U.S. Equity ETF 2-Year Total Returns
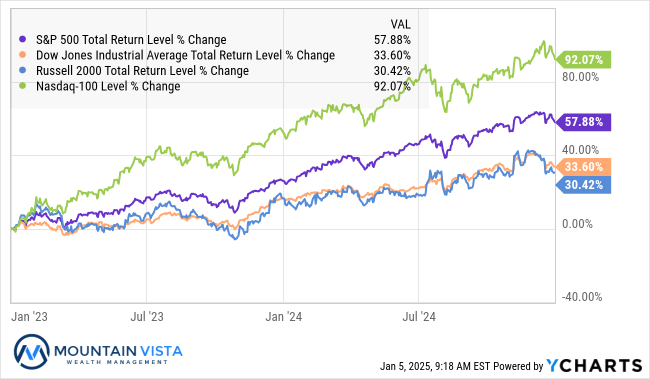
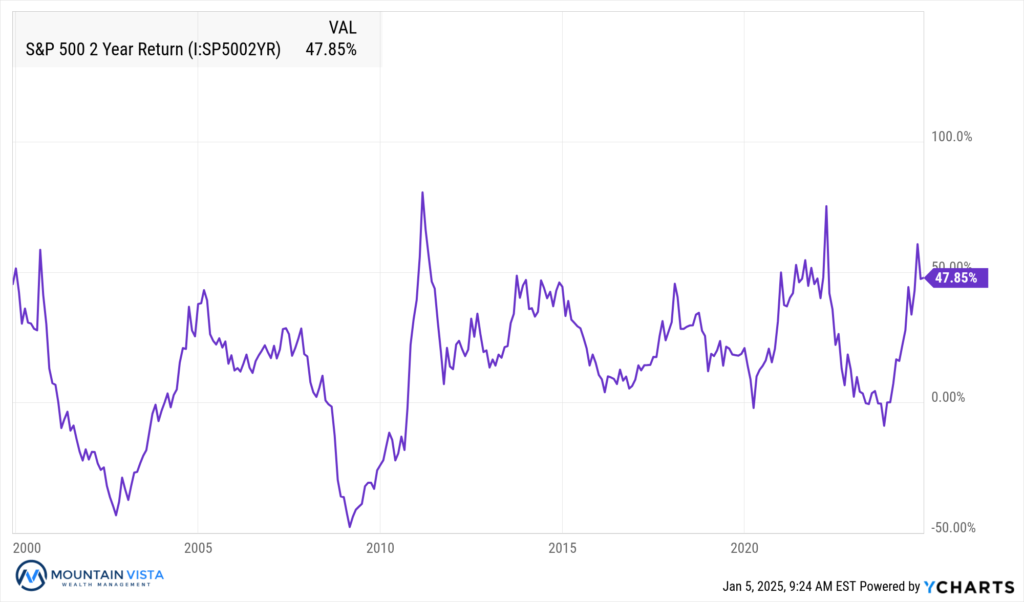
As you can see in the chart below, the market typically experiences periods of strong returns after difficult markets, such as the dot-com bust of the early 2000s, the Global Financial Crisis of 2008/2009, and Covid in 2020. Unfortunately, this strong pace of gains is not sustained, and two-year returns succumb to the weight of their valuation. That does not mean the market has to crash, but realize that the returns of the last two years are not the norm.
Figure 2: Rolling 2-Year Returns of the S&P 500
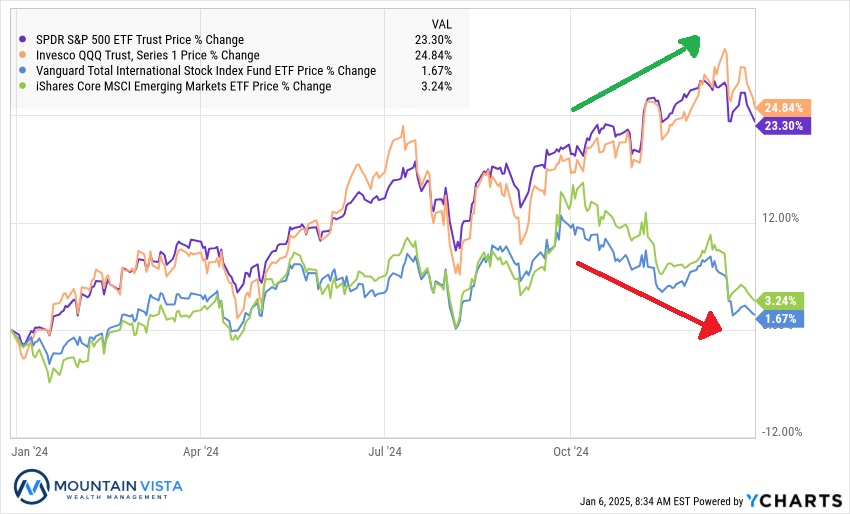
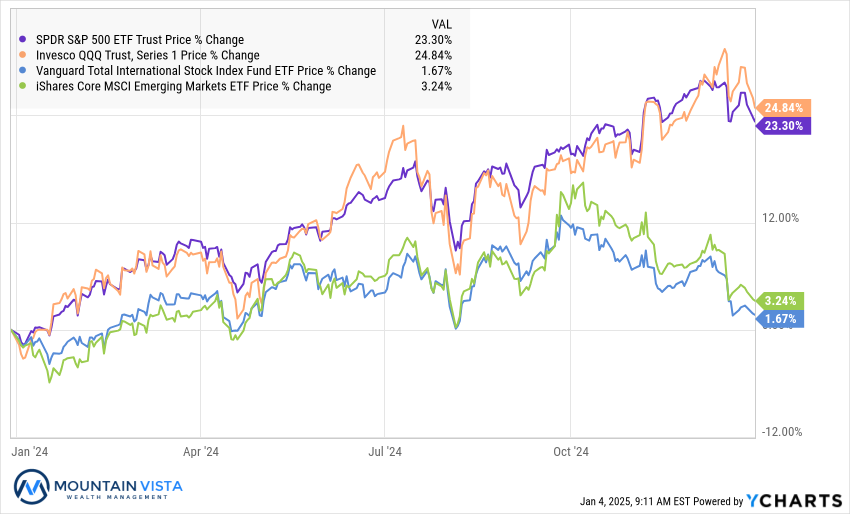
Leading up to the U.S. Presidential election, international stocks had produced strong gains, but that strength has since eroded. Investors have been buying U.S. stocks, at the expense of international stocks, on the expectation that the U.S. economy will benefit from protectionist tariff policies of the new administration and a deregulatory environment.
In the 4th quarter, SPY (S&P 500 ETF) outperformed VXUS (International ETF) by 9.9%. After years of underperformance, holders of international stocks will have to wait for their time in the sun. Some of this underperformance is due to the appreciation of the dollar, as the ICE U.S. Dollar Index surged 7.7% in the quarter.
Figure 3: U.S. and International Equity ETF Total Returns
Fixed income markets faced headwinds in Q4 2024, despite rate cuts from the Federal Reserve. While bonds rallied through Q3, persistent inflation, robust economic growth, and uncertainty around the upcoming administration’s policies drove long-term yields back near their 2023 peaks, disappointing investors who anticipated stronger bond performance.
Figure 4: AGG ETF Price and 10-Year U.S. Treasury Yield
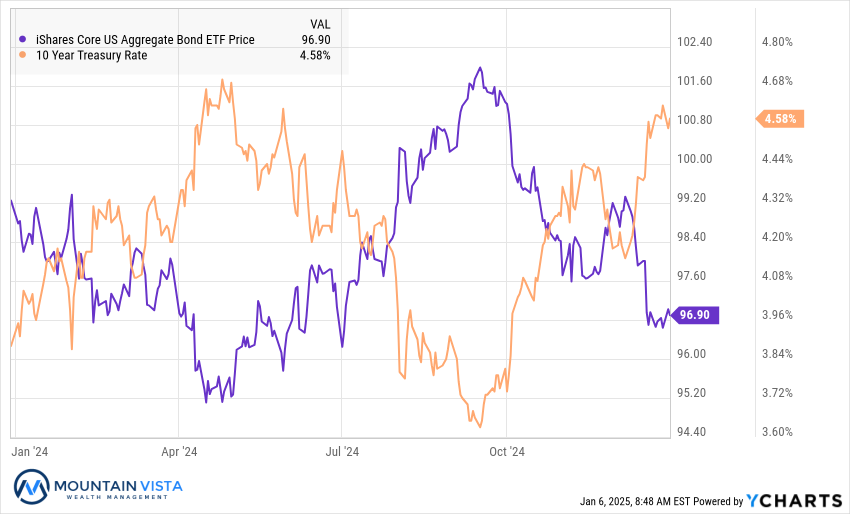
AGG (U.S. Aggregate Bond ETF) lost (-3.1%) in the 4th quarter, reducing its annual return to 1.3%. Longer duration bonds were hit even harder, with TLT (20+ year U.S. Treasury ETF) returning (-9.7%) in the quarter and (-8.1%) for the year. Junk bonds were the bright spot of the fixed income universe, with JNK (High Yield Bond ETF) generating a 7.7% total return for the full year.
Federal Reserve Continues to Cut Rates…For now
In mid-December, the Federal Reserve cut the Fed Funds rate by 25 bps to a target range of 4.25-4.5%. The Fed Funds rate now sits a full percentage point below its peak rate first reached in July 2023. While this cut was largely expected and shows continued progress towards reducing seemingly high short-term interest rates, the stock and bond markets both responded negatively to the release.
As you can see in the newly released Summary of Economic Projections below, the median projection of the Federal Reserve Board members upgraded projections of growth and inflation. They also reduced their expectations for rate cuts in 2025 from four to two, pushing the remaining cuts into 2026/27. In addition to releasing this more hawkish forecast, Federal Reserve Chairman, Jerome Powell, presented a much more balanced view of the risks of inflation and unemployment facing the U.S. economy.
Figure 5: Federal Reserve’s Summary of Economic Projections (December 2024)

While the stock market reaction took place during and after the press conference, the bond market had been sniffing out this change for some time. Since bottoming around 3.6% in September, the 10-year U.S. Treasury yield had already increased to 4.4% before the press conference. In the last two weeks, the yield has continued to increase and now sits almost 20 bps higher.
The Fed Cut Rates and Yields Went Higher
The Federal Reserve sets policy primarily by adjusting the Federal Funds Rate. While the “fed funds rate” effects the interest on floating rate loans and yields on short-term debt, it does not control yields on longer-term U.S. treasury bonds, mortgages and car loans. What impacts long-term interest rates is a complicated mix of market expectations about future economic growth and inflation, supply and demand, government fiscal responsibility and currency movements.
As you can see in the chart below, leading up to the first cut in the fed funds rate, the yield on 10-year U.S. Treasury Bonds was declining amidst soft employment data, recessionary concerns and approaching interest rate cuts.
Figure 6: Federal Funds Lower Target and 10-Year U.S. Treasury Yield
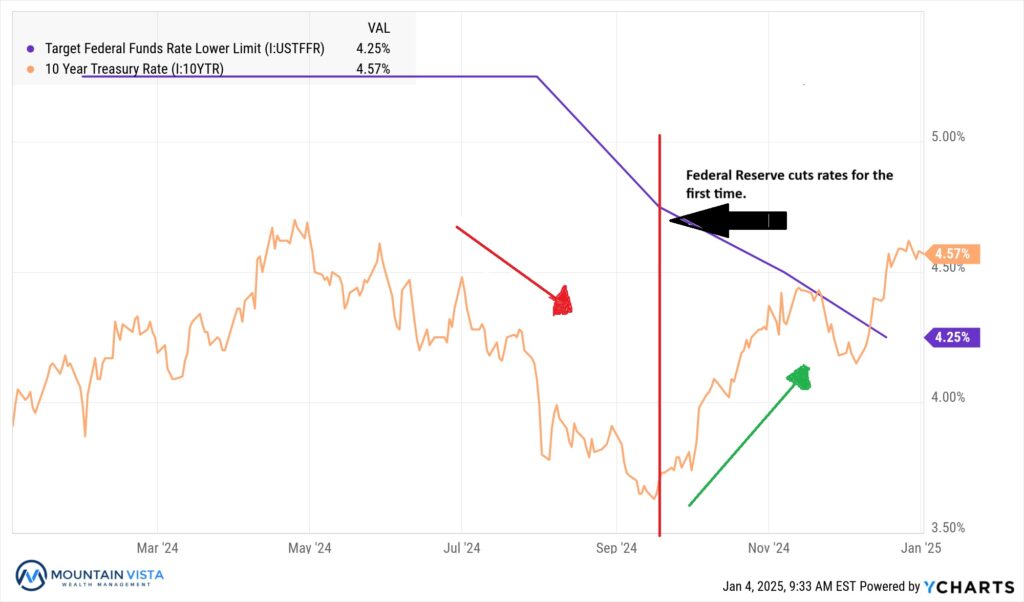
In our Q3 Investment Letter, we highlighted our belief that the economy was not as weak as the market at the time. Over the last few months, the market not only adopted our view, but ratcheted up expectations of growth and inflation after the election. The yield on 10-Year U.S. Treasury bonds increased almost a full 1% from mid-September through year-end.
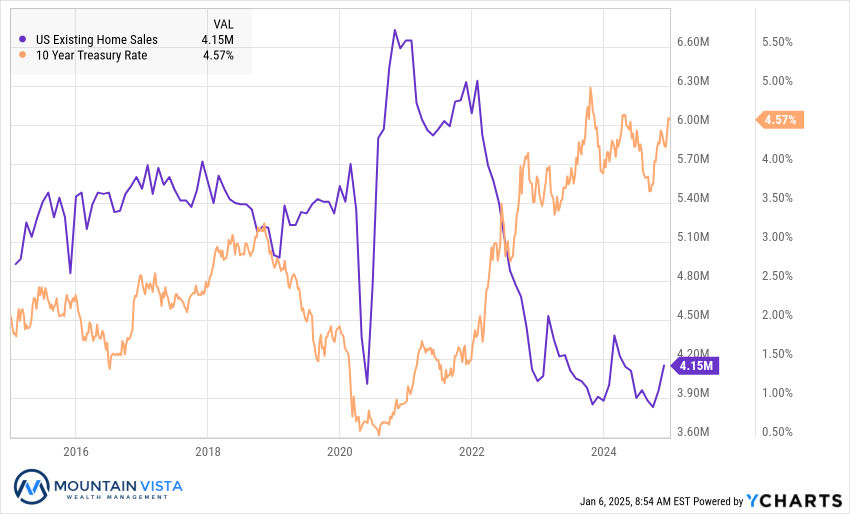
Moving forward, the path of long-term yields will be dependent upon developments in inflation, which appears to have bottomed for now, and the resilience of the employment market. At current levels, long-term interest rates remain restrictive, offsetting of the accommodation in short-term rates. In Figure 7, you can see the impact of high long-term rates on the housing market, a crucial sector for the economy.
Figure 7: U.S. Existing Home Sales and the 10-Year U.S. Treasury Yield
Bitcoin Celebrates While Other Commodities Suffer
In January 2024, the SEC approved various ETFs backed by spot Bitcoin. This approval was a crucial step towards legitimacy and mass adoption of this new asset class. Subsequently, Ethereum-backed ETFs were approved, though to much less fanfare. Access to ETFs has opened crypto to financial advisors and other traditional market participants that needed an easier, more secure way to access the crypto currency markets.
In November, Bitcoin prices jumped higher again upon the election of Donald Trump. During his campaign he embraced the industry, has appointed crypto-friendly cabinet members and has even hinted at the idea of a Bitcoin strategic reserve. While the latter seems unlikely in the near-term, it is a notable shift from the stance of government four years ago. Prices surged ~60% as a result.
Figure 8: Bitcoin and Various Commodity ETF Returns Before and After the Election
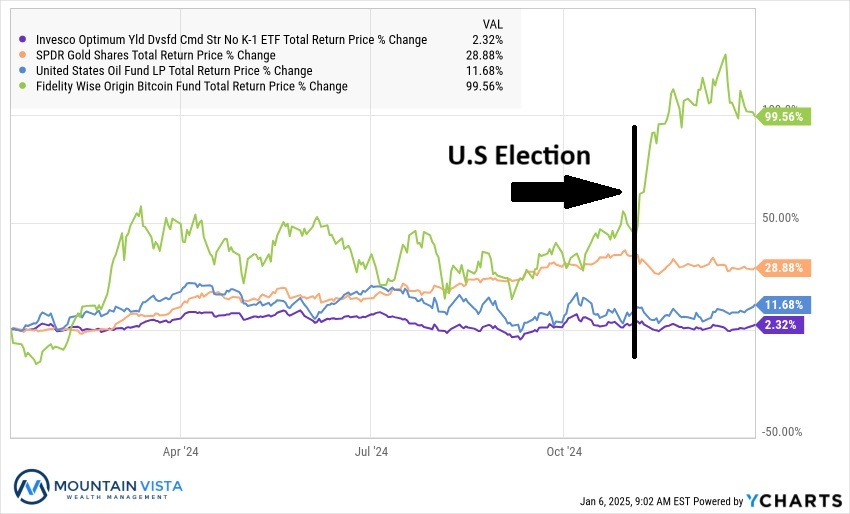
Traditional commodities have not responded as optimistically as Bitcoin. The expectation of tariffs, higher inflation, and, therefore, less interest rate cuts, has pushed the U.S. dollar higher against a basket of other currencies. Commodities typically suffer during periods of dollar strength. Furthermore, Bitcoin, commonly called “digital gold”, may be attracting investment that would otherwise have gone to gold. Finally, expectations of lower regulation and increased domestic oil production have kept oil prices in check.
Looking Forward
The S&P 500 is not cheap with a forward P/E multiple of 22-23x. For context, the 25-year average forward P/E multiple is 16.4. That said, the market can remain at high valuations for a long time and will likely require a catalyst to revert lower.
Valuations are much more reasonable in small and mid-cap stocks and international stocks. Overall, we see this as a time to rebalance towards more reasonably priced equities, ensure equity allocations are in line with risk tolerance, and stubbornly avoiding any FOMO-induced shifts towards higher risk.
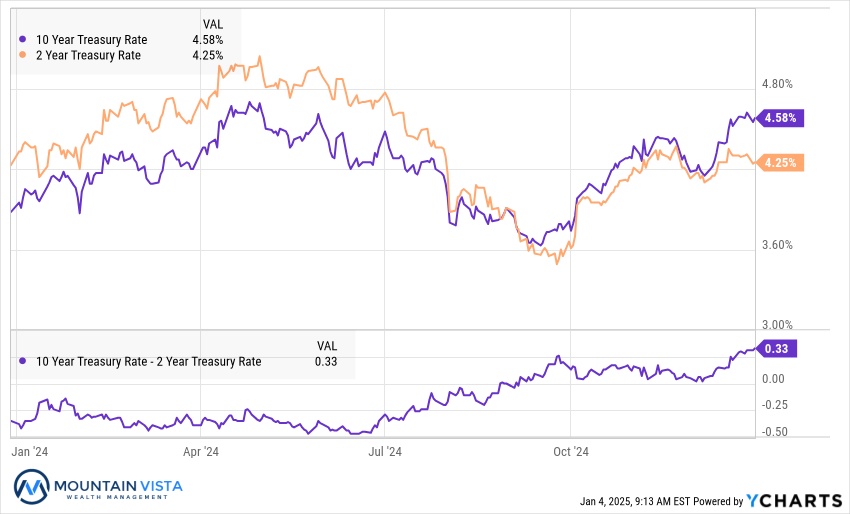
Long-term interest rates have marched higher while the Federal Reserve has been lowering short-term rates. The result is an expansion in the “term premium” of ~30 bps between 2-year and 10-year U.S. Treasury yields. While the spread makes long-term fixed income more attractive than it has been, the term premium is still low on a historical basis. With uncertainty about how aggressive the new administration will be with tariffs and the deficit; it is hard to predict the direction of yields with a high degree of confidence.
Our outlook for commodities is mixed. Oil prices were very weak during the last Trump administration, as the deregulatory environment encouraged more production. Energy independence will likely remain a central tenant of the administration’s agenda. Gold may do well should tax extensions/cuts lead to a continuation or expansion of the high deficits of the last few years. Finally, we expect Bitcoin to be very volatile and subject to a lot of headline risk.
Most of the securities that responded very strongly after the election have unwound those gains, but Bitcoin has remained resilient. If stocks hit a soft patch, Bitcoin could follow suit in absence of a positive catalyst. On the other hand, the introduction of a strategic reserve would push prices much higher. We see this as unlikely in the near-term and Federal Reserve Chair, Jerome Powell, said as much at the last press conference.
Economic policy is very uncertain after the U.S. election. The administration has large, untested policy goals and, if implemented, the economic impact is not completely clear. The market’s reaction will be dictated by the speed and severity of the policy implementation. To be successful in this environment, we need to remain flexible and humble.
As always, we appreciate your time in reviewing this commentary and welcome any questions that you may have on these or other topics of interest.
APPENDIX
Equity Index ETF Total Return
| ETF | Description | Q4 2024 Total Return | 2024 Total Return | 3-Year Total Return |
| SPY | S&P 500 | 2.5% | 24.9% | 28.9% |
| QQQ | Nasdaq 100 | 4.9% | 25.6% | 31.1% |
| IWM | Russell 2000 | 0.3% | 11.4% | 3.5% |
| IVW | S&P 500 Growth | 6.2% | 35.8% | 24.3% |
| IVE | S&P 500 Value | (2.7%) | 12.0% | 29.4% |
| VXUS | International Ex-US | (7.4%) | 5.1% | 2.2% |
| IEMG | Emerging Markets | (7.1%) | 6.5% | (5.0%) |
U.S. Equity Sector Total Return
| ETF | Description | Q4 2024 Total Return | 2024 Total Return | 3-Year Total Return |
| XLY | Consumer Disc | 12.2% | 26.5% | 12.6% |
| XLC | Communications | 7.4% | 34.7% | 28.4% |
| XLF | Financials | 7.1% | 30.6% | 30.8% |
| IYZ | Telecom | 6.7% | 20.5% | (12.7%) |
| XLK | Technology | 3.2% | 21.6% | 37.2% |
| XLE | Energy | (1.6%) | 5.6% | 72.4% |
| XLI | Industrials | (2.2%) | 17.3% | 30.9% |
| XLP | Consumer Staples | (4.6%) | 12.2% | 10.4% |
| XLU | Utilities | (5.5%) | 23.3% | 16.1% |
| XLRE | Real Estate | (8.0%) | 5.1% | (12.9%) |
| XLV | Healthcare | (10.3%) | 2.5% | 2.4% |
| XLB | Materials | (12.2%) | 0.2% | (1.2%) |
U.S. Equity Sector Total Return

Global Equity ETF Total Return
Fixed Income ETF Total Return
| ETF | Description | Q4 2024 Total Return | 2024 Total Return | 3-Year Total Return |
| AGG | Aggregate Bond | (3.1%) | 1.3% | (6.9%) |
| BND | Total Bond Market | (3.1%) | 1.4% | (6.9%) |
| LQD | IG Corporate | (4.1%) | 0.9% | (9.4%) |
| JNK | HY Corporate | (0.2%) | 7.7% | 6.3% |
| EMB | $ EM Bonds | (2.9%) | 5.5% | (5.0%) |
| SHY | 1-3 Yr Treasuries | (0.1%) | 3.9% | 4.0% |
| IEF | 7-10 Yr Treasuries | (4.6%) | (0.6%) | (12.6%) |
| TLT | 20+ Yr Treasuries | (9.7%) | (8.1%) | (35.0%) |
| TIP | TIPs | (3.0%) | 1.7% | (7.4%) |
U.S. Treasury Yields and 2/10 Spread
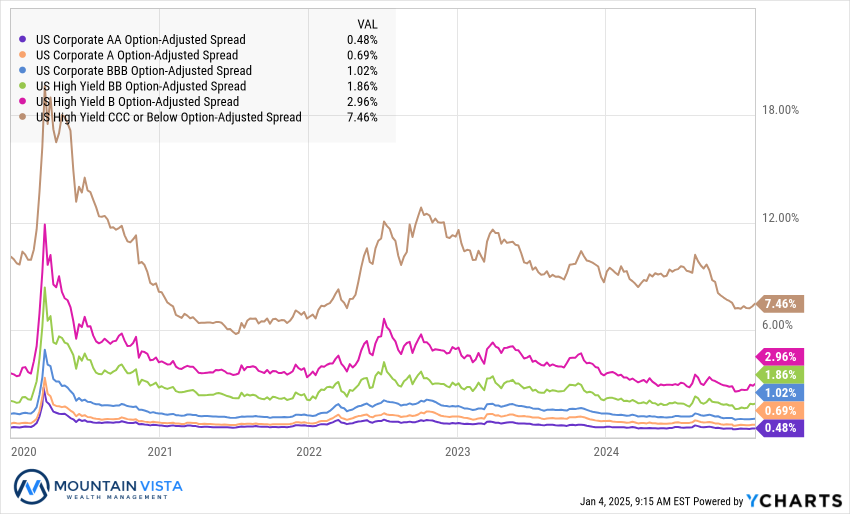
U.S. Corporate Credit Spreads
Commodity and Bitcoin Total Return
| ETF | Description | Q4 2024 Total Return | 2024 Total Return | 3-Year Total Return |
| PDBC | Diversified Commodity | 1.1% | 2.1% | 14.1% |
| GLD | Gold | (0.4%) | 26.7% | 41.6% |
| DBB | Base Metals | (5.0%) | 7.9% | (3.7%) |
| USO | Oil | 8.1% | 13.4% | 39.0% |
| FBTC | Bitcoin* | 46.9% | 99.6% | N/A |
| * FBTC 2024 Total Return calculated from January 11, 2024 | ||||
Disclaimer
The views and opinions expressed are for informational and educational purposes only as of the date of writing and may change at any time based on market or other conditions and may not come to pass. This material is not intended to be relied upon as investment advice or recommendations, does not constitute a solicitation to buy or sell securities and should not be considered specific legal, investment or tax advice. The information provided does not take into account the specific objectives, financial situation, or particular needs of any specific person. All investments carry a certain degree of risk and there is no assurance that an investment will provide positive performance over any period of time. Equity investments are subject to market risk or the risk that stocks will decline in response to such factors as adverse company news or industry developments or a general economic decline. Debt or fixed income securities are subject to market risk, credit risk, interest rate risk, call risk, tax risk, political and economic risk, and income risk. As interest rates rise, bond prices fall. Non-investment-grade bonds involve heightened credit risk, liquidity risk, and potential for default. Foreign investing involves additional risks, including currency fluctuation, political and economic instability, lack of liquidity and differing legal and accounting standards. These risks are magnified in emerging markets. Past performance is no guarantee of future results.