INTRODUCTION
Before diving into the market overview, I wanted to announce that Michael J. Riolo, J.D. has joined Mountain Vista Wealth Management as a Senior Financial Advisor and Head of Financial Planning. Michael brings a wealth of financial planning experience to Mountain Vista and his expertise in the area of estate planning will be valuable to our clients. To learn more about Michael, please feel free to review his bio at the following link: https://mountainvistawealth.com/about/. We are excited to have him on the team and I encourage all of our clients to take advantage of his expertise.
Investor, Warren Buffett, famously said: “be fearful when others are greedy and greedy when others are fearful”. If you prepare during the good times, namely raising cash or increasing fixed income exposures, then you can put yourself in a position to be opportunistic during market downturns and try to avoid the unpleasant feeling of being fully invested at the start of a bear market. While this behavior may serve as a source of alpha in your portfolios, it also promotes good long-term investing behavior, decreasing the likelihood of irrational, panicked selling. Is it time for you to be greedy or fearful? We are here to help you answer that question.
Finally, a special thanks to all of our clients for their continued support. We remain focused on delivering long-term investment returns, while taking into account our clients’ goals and risk tolerance. As always, we are available to discuss any questions or concerns that you may have.
We at Mountain Vista Wealth Management wish you a Happy New Year and look forward to a prosperous 2019!
Sincerely,

President and CIO
OVERALL MARKET COMMENTARY
The year 2018 was full of contradictions. It began with investors focused on rising interest rates, increasing inflation, and above trend growth. Real gross domestic product (“GDP”) growth peaked at 4.2% in the second quarter, the 10-year treasury rate rose above 3.2%, and the S&P 500 was up over 11% at its peak. In the 4th quarter, the sentiment quickly changed leaving us concerned about slowing growth and an unsupportive Federal Reserve. Defensive and income producing investments that lagged in the first half of the year outperformed in the new regime, while the previous market leaders were left for dead.
The rapid change in market sentiment led to significant volatility that left few asset classes unscathed. The S&P 500 fell as much as (20%) from its September high and the 10-year treasury yield closed the year at 2.7% after peaking above 3.2%. What looked to be another solid year of returns for the equity market heading into the 4th quarter quickly turned out to be a year to forget. Alternatively, fixed income, which was discarded in early 2018, recovered to end the year largely flat. A far cry from the disaster scenario that some market pundits were predicting.
While there are a multitude of forces driving markets today, the two most important issues we see are Federal Reserve policy and slowing global growth. US-China trade negotiations make for great headlines, but this is an issue that will likely drag on for some time with no quick resolution. This is not to downplay the importance of trade wars, but their effect on markets should be contained to the resulting impact on growth. Also, we have reached a point where further escalation is unlikely and the market has arguably reflected the future implications.
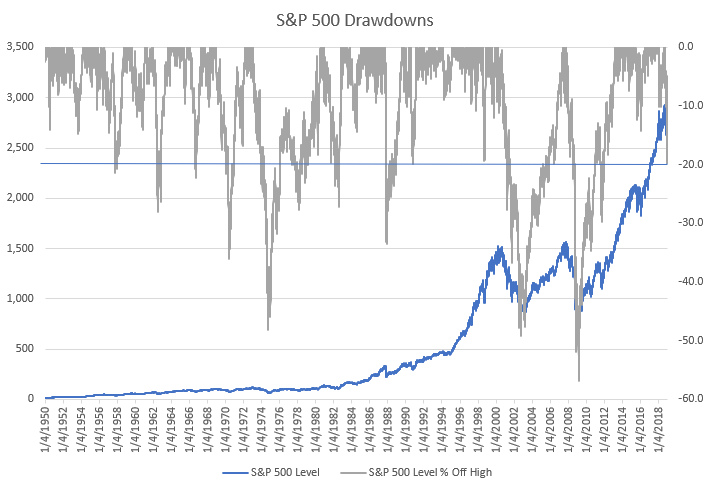
As we close the year, we find ourselves in the midst of the largest equity decline since 2011. On December 26th, the S&P 500 traded down as much as (20%) from the September high. While such a decline is unsettling, it important to remember that equities do suffer significant drawdowns occasionally. As you can see in Figure 1 below, the S&P 500 has had numerous corrections of similar or greater magnitude since 1950 and investors who remained steadfast were eventually rewarded with much higher prices in the future. While prices may fall further in the near-term, we have no reason to believe that this time will be different.
Figure 1: S&P 500 Historical Drawdowns

Looking ahead, 2019 will likely be a year of transition. With growth slowing, investors are questioning whether the economy is heading into a recession. While a number of economic indicators are pointing to a slowdown in growth, calls for a recession seem premature. With the Federal government running large budget deficits post tax reform, the Federal Reserve will once again be the likely source of any countercyclical stimulus. The market will be focused not only on the level of interest rates, but also on any changes to the pace of the Federal Reserve’s disposition of assets acquired during its Quantitative Easing (“QE”) program.
As a reminder, the Federal Reserve stopped purchasing treasury and mortgage-backed securities in 2015 when holdings reached $4.5 trillion. In late 2017 the Fed started Quantitative Tightening (“QT”), which is the managed reduction in the portfolio. The portfolio ended 2018 just above $4 trillion. QE was supportive of liquidity, volatility, credit spreads, and equity prices. Many investors are afraid that QT will have the opposite effect, so even if the Fed stops increasing rates, continuing QT will tighten financial conditions.
We should also note that away from the U.S., the European Central Bank (“ECB”) will stop their bond buying program in January 2019. With slowing growth in Europe and talk of pausing rate hikes in the U.S., the timing of this move is questionable at best. The growing portfolio of central bank owned assets is commonly cited by market prognosticators, mostly bearish, as the cause of heightened equity prices. In 2019 we may finally see what happens when the growth of central bank owned assets starts to decrease.
The high degree of macroeconomic uncertainty leads us to be more conservative in our asset allocation and overweight defensive, income producing sectors, relative to growth. That being said, we remain guided by our client’s asset allocation and will pivot if conditions warrant. Historically, investors that diligently rebalance their portfolio and fight the urge to panic have been rewarded. We do not expect this time to be any different.
EQUITY MARKET
Figure 2: Equity Index ETF Returns
| ETF | Description | Price | 2nd Half Total Return | 2018 Total Return |
| SPY | S&P 500 | 245.8 | (6.9%) | (4.6%) |
| QQQ | Nasdaq 100 | 150.6 | (9.7%) | (0.1%) |
| IWM | Russell 2000 | 132.0 | (17.4%) | (11.1%) |
| IVW | S&P 500 Growth | 150.7 | (6.8%) | (0.2%) |
| IVE | S&P 500 Value | 101.1 | (7.0%) | (9.2%) |
| VXUS | Total International Stock | 47.0 | (11.3%) | (14.4%) |
| IEMG | Emerging Markets | 47.2 | (8.6%) | (14.9%) |
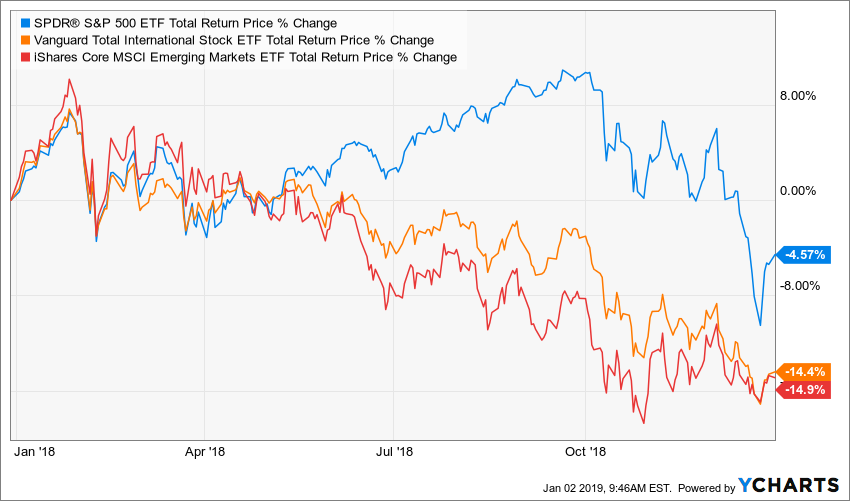
SPY (S&P 500 ETF) was up almost 11% year-to-date in September, but disappointingly ended the year in negative territory. Not that it is much of a consolation, but the U.S. did handily outperform international and emerging market equities. At the close on October 4th, SPY had outperformed IEMG (Emerging Market ETF) by 22% for the year. Since that point, IEMG has outperformed by 12%. The outperformance was driven by the strength of the U.S. dollar and the temporary boost to growth provided by the fiscal stimulus of last year’s tax reform. The positive effects of this stimulus will not be felt as strongly in 2019, so it would not be surprising to see the recent trend of convergence continue in 2019.
It is interesting to note that growth once again outperformed value. While some highly visible growth stocks, such as AMZN, GOOGL and NFLX, experienced significant declines in the 4th quarter, they have all produced positive returns year-to-date. IVW (S&P 500 Growth) has outperformed IVE (S&P 500 Value) by 9%. Also of note, the drop in small cap stocks since the end of September has been dramatic. The IWM (Russell 2000 ETF) fell 25% from its high-water mark at the end of August to end the year down (11%).
Finally, IEMG (Emerging Market ETF) closed the year down (15%). A strong dollar, slowing growth in China, and a persistent deterioration in US-China trade negotiations created a perfect storm. This performance is made all the more disappointing when compared to its 2017 return of 34%. Despite what can only be described as a disastrous year, we believe that Emerging Market equities offer diversification benefits and attractive long-term return potential, despite their current weakness.
In a reversal from the first 6 months of the year, defensive dividend paying sectors, such as Utilities (XLU) and Consumer Staples (XLP) were the top performers in the second half of 2018. Slowing economic growth expectations and heightened risk aversion have replaced fears of higher rates. XLU was down 10% YTD in early February, but it managed to end the year with a total return of 4%. See the full breakdown of the sector level returns below in Figure 3.
Figure 3: Equity Sector Returns
| ETF | Description | 2nd Half Total Return | 2018 Total Return | |
| XLU | Utilities | 3.6% | 3.9% | |
| XLV | Healthcare | 4.5% | 6.3% | |
| XLP | Consumer Staples | 0.1% | (8.1%) | |
| IYZ | Telecom | (3.9%) | (8.6%) | |
| XLI | Industrials | (9.1%) | (13.2%) | |
| XLY | Consumer Disc | (8.8%) | 1.6% | |
| XLK | Technology | (10.1%) | (1.7%) | |
| XLF | Financials | (9.5%) | (13.1%) | |
| XLB | Materials | (12.0%) | (14.9%) | |
| XLE | Energy | (23.2%) | (18.2%) |
On the contrary, high growth and cyclically sensitive sectors, such as Technology (XLK), Financials (XLF), and Energy (XLE) suffered large declines in the 4th quarter. XLE was up almost 8% in early October, but over the last three months it has fallen (26%) to end the year down (18%). XLK peaked with a year-to-date total return of 19% in October and ended the year slightly negative.
International and Emerging Market equities have been under pressure all year (see Figure 4 below). The strong dollar, slowing local growth and tough trade rhetoric all weighed on sentiment. Until October, the U.S. equity market was a significant outperformer. With the fiscal stimulus from the tax cuts behind us, growth expectations in the U.S. are also on the decline and that outperformance is being quickly unwound. We would not be surprised to see this converging trend persist into 2019. With the ECB ending asset purchases in 2019, Emerging Market equities are a more attractive way to express this view as they will not have any direct exposure to Europe.
Figure 4: 2018 Global Equity Returns

FIXED INCOME MARKET
Figure 5: Fixed Income Returns
| ETF | Description | 2nd Half Total Return | 2018 Total Return | |
| AGG | Aggregate Bond | 1.8% | 0.1% | |
| BND | Total Bond Market | 1.7% | (0.1%) | |
| LQD | IG Corporate | 0.6% | (3.8%) | |
| JNK | HY Corporate | (2.1%) | (3.3%) | |
| EMB | $ EM Bonds | 1.1% | (5.5%) | |
| SHY | 1-3 Yr Treasuries | 1.4% | 1.5% | |
| IEF | 7-10 Yr Treasuries | 3.1% | 1.0% | |
| TLT | 20+ Yr Treasuries | 1.4% | (1.6%) | |
| TIP | TIPs | (1.4%) | (1.4%) |
At the onset of 2018, very few investors wanted exposure to fixed income. Rising short-term interest rates, the disposition of the Federal Reserve’s treasury holdings, and rising inflation all combined to create an unfavorable environment for bonds. We maintained the view that interest rates would increase, particularly in the front end of the curve, but that long-term rates would not increase in the same dramatic manner. Our belief is that higher borrowing costs for companies, home buyers, and consumers would put pressure on economic growth and, in turn, apply downward pressure to long-term rates. This thesis played out in the 4th quarter as signs of a slowing economy have caused long-term rates to fall significantly from their high point.
The result is a year of mostly negative returns in the fixed income universe, but hardly the disaster scenario that many predicted entering 2018. AGG (Barclays Aggregate Fixed Income ETF) was virtually flat for the year after taking into account dividends and interest and was only down (3%) at its low point in May. EMB (USD EM Bond ETF) and LQD (Investment Grade Corporate ETF) were the worst performing corners of the Fixed Income universe with total returns of (6%) and (4%), respectively.
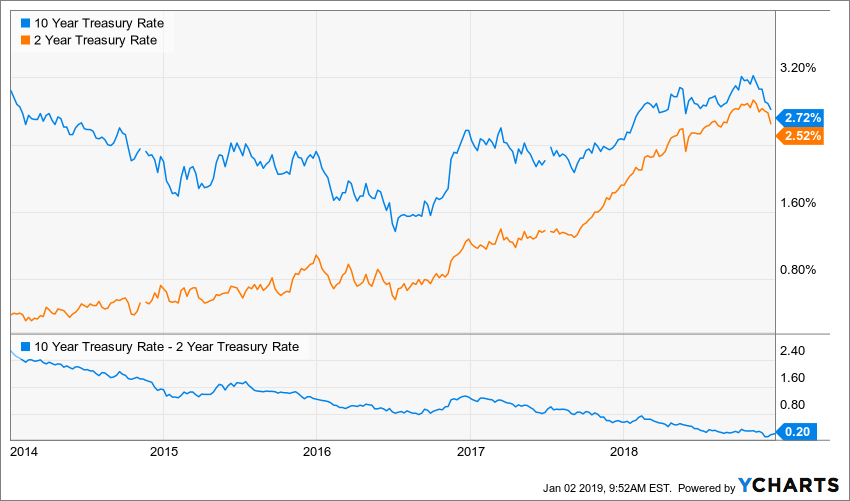
Figure 6: U.S. Treasury Yields

The spread between the 2-year and 10-year treasury yields is a widely tracked indicator that investors use to predict a coming recession. With the Federal Reserve driving short-term interest rates and well anchored long-term interest rates, this spread has continued to decline all year. In December, the 2-10-year treasury spread reached a cycle low of 11 basis points, or 0.11%. While this indicator has indeed preceded recessions in the past, it has also produced a number of false positives. While we would prefer to see a greater spread, in the current era of low trend growth and low interest rates, it is possible that this indicator is not as useful as it has been in the past. Furthermore, a dovish shift by the Federal Reserve could steepen the curve if they become concerned over the state of the economy.
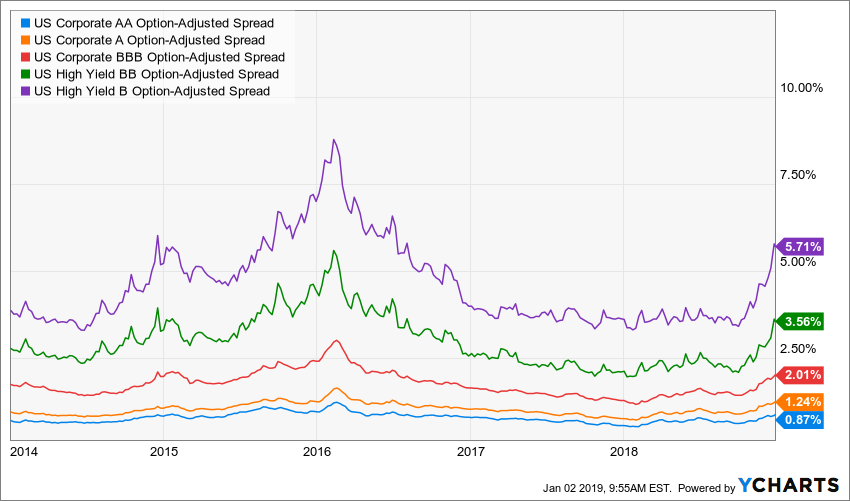
Figure 7: U.S. Corporate Credit Spreads

Corporate credit spreads remained resilient to the volatility in the equity markets for most of the year, but rose sharply in the 4th quarter. The poor returns for investment grade credit over the 1st half of 2018 were a factor of higher risk-free rates, rather than higher credit spreads. As a reminder, credit spreads are the incremental return above the risk-free rate that a corporate bond investor requires to take the increased liquidity and default risk. The rapid increase in spreads in the 4th quarter implies that investors have become much more concerned about default risk than they were throughout the year. The last time credit spreads were this wide was 2016, during the Oil & Gas default cycle.
The widening in spreads has been somewhat dampened by the 0.4% rally in the 5-year U.S. Treasury rate during the 4th quarter. Given the significant steepening of the credit curve, the impact on yields has been much more acutely felt by lower rated bonds. For example, the 32 bps widening of A-rated bonds has been entirely offset by a 36 bps drop in the 5-year U.S. Treasury yield; whereas B-rated high yield bonds have widened by 238 bps during this period, resulting in much higher yields for these borrowers.
This is a trend to follow, because wider credit spreads make borrowing more expensive for corporations and are generally indicative of a banks willingness to lend. With higher risk-free rates and wider spreads, some marginal companies may not be able to service existing debt levels
or refinance outstanding debts when they mature. While both are problematic, we are more concerned about the trends in credit spreads than the 2-10-year treasury spread.
CONCLUSION
The change in regime that took place in the 4th quarter was rapid and severe, but for someone following global equity performance, the strong performance of the U.S. economy and equity markets was the outlier. With the fiscal stimulus provided by the Tax Cuts & Jobs Act wearing off, it is not completely surprising that the performance of U.S. markets converged with international markets. That being said, the pace of the normalization and regime shift was surprising.
Financial conditions started to tighten considerably at the close of 2018. Our baseline view is that the Federal Reserve will proceed cautiously and will pause if financial conditions tighten too much. With sentiment overwhelmingly negative, a significant dovish pivot from the Fed could surprise markets to the upside. If they continue to push forward with rate hikes and balance sheet reduction, ignoring the warning signs from lower U.S. Treasury yields and wider corporate credit spreads, the market is unlikely to recover in 2019.
Over the long-term, we continue to believe that equities are the best source of real returns, but in the current environment we believe that a slightly defensive posture is warranted. To the extent that the Federal Reserve becomes more accommodative, we will respond accordingly.
Our focus is long-term value creation for our clients and creating investment portfolios that will perform within their risk appetite. The market will not always go up, but it is important to keep your eyes on the horizon and to ride out the short-term gyrations. We thank you for entrusting us with the responsibility of managing your portfolio and being a client of Mountain Vista.
Disclaimer
The views and opinions expressed are for informational and educational purposes only as of the date of writing and may change at any time based on market or other conditions and may not come to pass. This material is not intended to be relied upon as investment advice or recommendations, does not constitute a solicitation to buy or sell securities and should not be considered specific legal, investment or tax advice. The information provided does not take into account the specific objectives, financial situation, or particular needs of any specific person. All investments carry a certain degree of risk and there is no assurance that an investment will provide positive performance over any period of time. Equity investments are subject to market risk or the risk that stocks will decline in response to such factors as adverse company news or industry developments or a general economic decline. Debt or fixed income securities are subject to market risk, credit risk, interest rate risk, call risk, tax risk, political and economic risk, and income risk. As interest rates rise, bond prices fall. Non-investment-grade bonds involve heightened credit risk, liquidity risk, and potential for default. Foreign investing involves additional risks, including currency fluctuation, political and economic instability, lack of liquidity and differing legal and accounting standards. These risks are magnified in emerging markets. Past performance is no guarantee of future results.