
INTRODUCTION
“The biggest investing errors come not from factors that are informational or analytical, but from those that are psychological.”
– Howard Marks
Every few quarters, I feel the need to remind everyone to check their emotions when it comes to the portfolio. It is easy to get caught up in the current zeitgeist, whether that be technological, political or just a popular narrative. The news, social media and conversations of friends reinforce a common way of thinking. When these channels reach saturation, it is usually a great time for a reversal of trend.
If you find yourself asking, “why do I own any bonds?” or feel a bit of FOMO after hearing about a neighbor’s windfall from an AI investment, remember that the stock market doesn’t always go up. Today’s biggest winners, commonly become the biggest losers, at least temporarily, when the tide shifts. You want a portfolio that will perform over 10 years, not one or two.
The hedge fund Situational Awareness, which we’ll discuss in more detail in the letter, completely nailed the AI trade, buying AI infrastructure and shorting software, but failed to take profits along the way and ended up having to liquidate all their public market positions. Sometimes you can be completely right, and things go completely wrong, if you create a portfolio that does not withstand volatility.
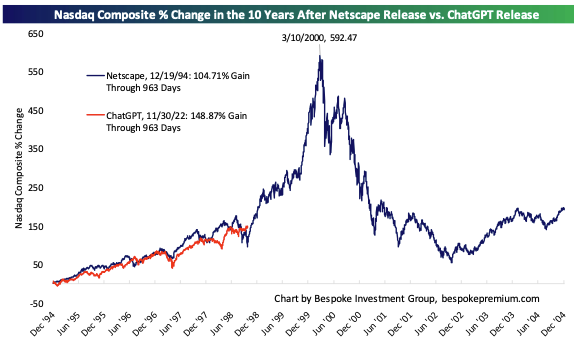
Finally, calling a top in the market is tough, so just remember to rebalance along the way. Consider this chart comparing the Nasdaq’s returns since Chat GPT was announced vs. Netscape’s release in the 1990s.
We’re grateful to work with such thoughtful, engaged clients, and we never take your trust for granted. Thank you for allowing us the privilege of safeguarding your hard-earned savings.
Sincerely,
Jonathan R. Heagle, CFP®, CFA
President and Chief Investment Officer
QUARTERLY ROUNDUP
Market Performance Overview
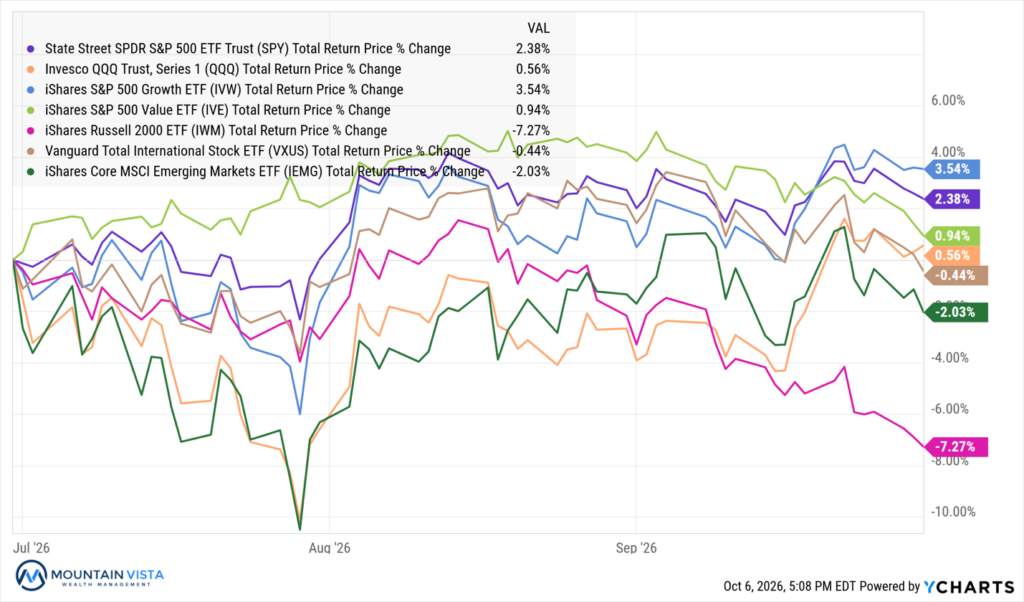
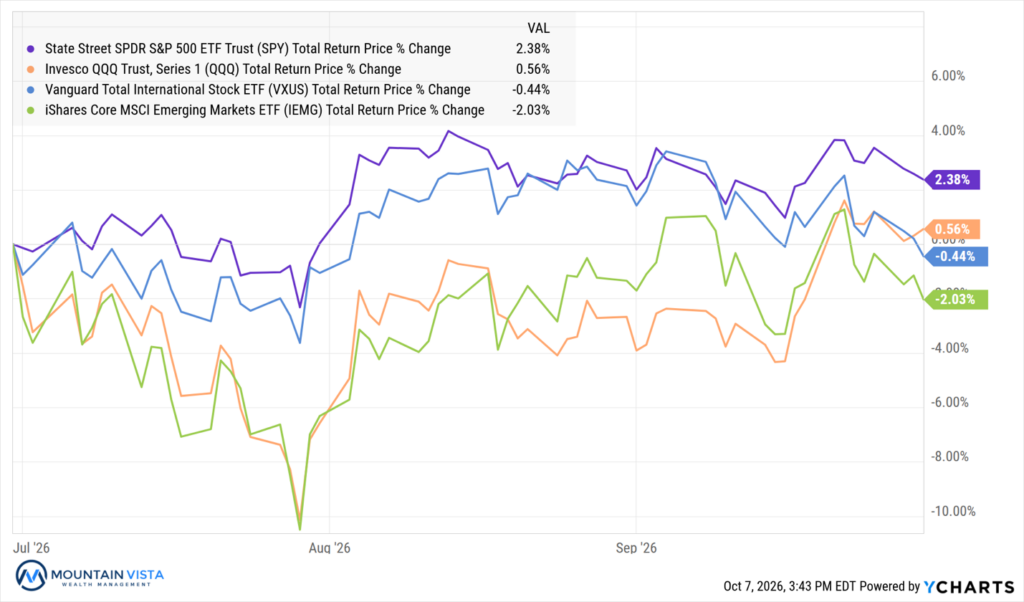
Markets were mixed in the third quarter, with gains concentrated in large-cap U.S. equities while several other areas of the market moved lower. The S&P 500 (SPY) gained 2.4% for the quarter and 12.7% year-to-date. Growth stocks continued to outperform, as S&P 500 Growth (IVW) rose 3.5% in Q3 compared with a 0.9% gain for S&P 500 Value (IVE). The Nasdaq 100 (QQQ) gained a more modest 0.6% during the quarter but remained one of the strongest major equity categories in 2026, up 20.8% year-to-date. Small-cap stocks moved sharply lower, with the Russell 2000 (IWM) falling (-7.3%) in Q3, although it remained up 13.7% for the year. International stocks were also weaker, with developed international equities (VXUS) declining (-0.4%) and emerging markets (IEMG) falling
(-2.0%).
Figure 1: Global Equity Index Total Returns
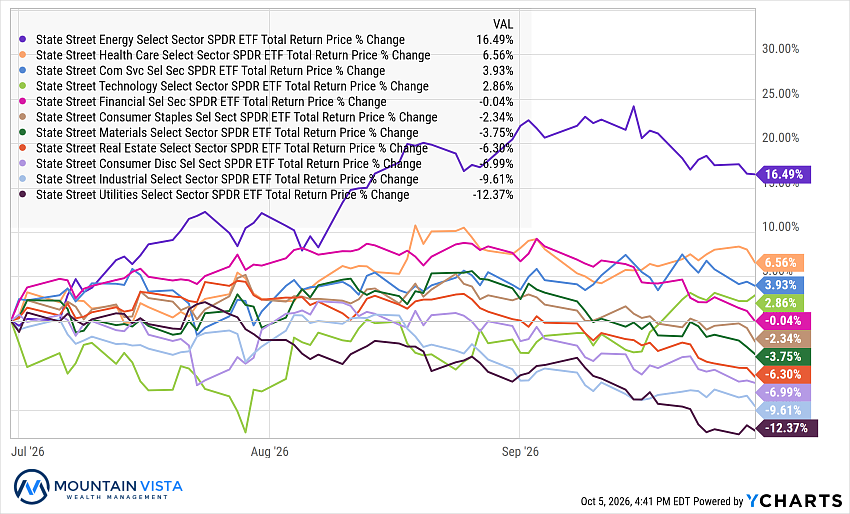
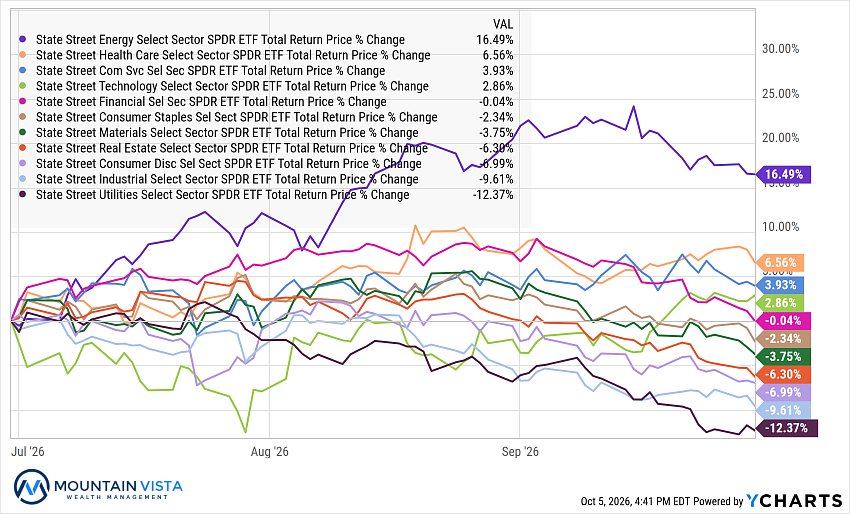
Sector performance was highly dispersed. Energy (XLE) was the clear standout, gaining 16.5% during the quarter and 40.3% year-to-date. Healthcare (XLV) rose 6.6%, while Communications (XLC) and Technology (XLK) gained 3.9% and 2.9%, respectively. At the other end of the spectrum, Utilities (XLU) declined (-12.4%), Industrials (XLI) fell (-9.6%), Consumer Discretionary (XLY) lost (-7.0%), and Real Estate (XLRE) declined (-6.3%). Technology remained the second best-performing sector year-to-date, gaining 36.5%, while Energy maintained the strongest 2026 return.
Figure 2: Quarterly S&P 500 Sector Total Returns
Fixed income struggled broadly during the quarter. The iShares U.S. Aggregate Bond Index (AGG) declined (-3.5%), while investment-grade corporate bonds (LQD) fell (-5.2%) and high-yield corporate bonds (JNK) declined (-2.1%). Longer-duration Treasuries experienced the largest losses, with 7–10 Year Treasuries (IEF) falling (-4.6%) and 20+ Year Treasuries (TLT) declining (-9.0%). Short-term Treasuries provided considerably more stability, with 1–3 Year Treasuries (SHY) declining just (-0.2%) during the quarter and remaining slightly positive for the year.
Commodities and digital assets produced some of the quarter’s strongest returns. Diversified commodities (PDBC) gained 21.5% in Q3 and 45.7% year-to-date, supported by a 36.8% quarterly gain in oil (USO), which has more than doubled in 2026. Gold (GLD) gained 3.4% for the quarter, while base metals (DBB) rose 5.0%. Digital assets also rallied sharply, with Bitcoin (FBTC) gaining 42.3% and Ethereum (ETHA) rising 69.2% during the quarter. Despite those gains, both remained negative for the year, illustrating the significant volatility that has characterized the asset class in 2026.
Sticky Inflation Leads the Fed to Hike
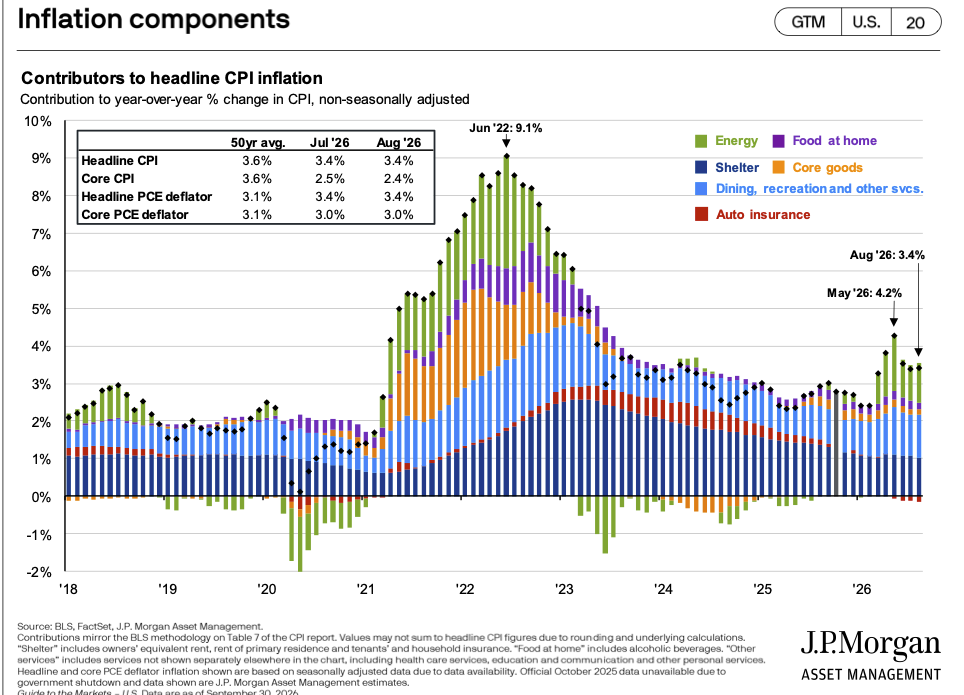
Disruptions to the global supply of oil and refining capacity, resulting from the war in Iran, have caused headline CPI to remain elevated at 3.4% in August’s reading. Core CPI, which removes Food and Energy, was also at 3.6%. These readings remain well above the Federal Reserve’s stated goal of 2%. On a positive note, almost all the increase in inflation is being driven by energy, so any resolution to the stand-off in Iran could translate quickly to lower inflation.
Figure 3: Components of the Consumer Price Inflation
The Federal Reserve Board met in September amidst this higher inflation backdrop and raised the target federal funds rate by 25 bps to a range of 3.75% to 4.00%. This is the first rate increase in about three years and is in stark contrast to the rate cuts that were expected at the end of 2025.
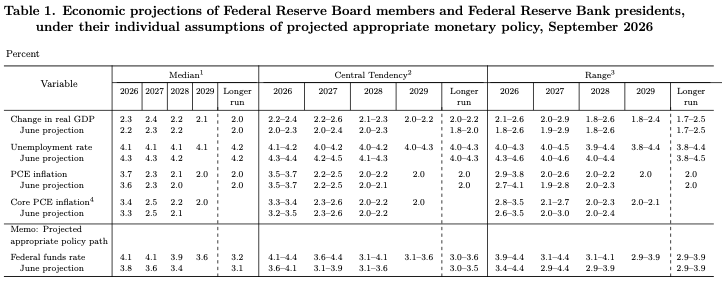
In their Summary of Economic Projections, the median projections for GDP, inflation and Fed Funds rate were all revised higher, while Unemployment was lowered marginally. These changes reflect the strong performance of the economy and stabilization of employment trends. Most policymakers expect at least one more rate hike in 2026.
Figure 4: Fed Summary of Economic Projections – September 2026
Interest Rates Surge higher
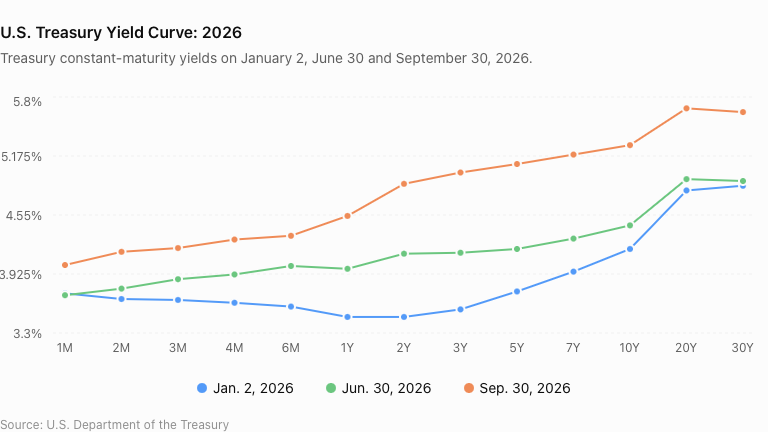
Coming into 2026, the market was expecting a handful of further rate cuts, reflecting disinflationary conditions, a weak employment market and the potential for a dovish Federal Reserve Chair. Over the last 9 months, conditions have changed dramatically. The Iran war and high energy prices are stoking inflation, while the employment market is firming up. Furthermore, Fed Chair Warsh reiterated a commitment to reaching 2% inflation and supported a rate hike at his second meeting as Chair.
As you can see in Figure 5, the projected rate cuts were priced out of the market by June 30th, but as of September 30th, long-term rates have marched substantially higher. The 10-year U.S. Treasury yield has increased by over 100 bps since the start of the year, with 85 bps occurring in the last three months.
Figure 5: Change in the U.S. Treasury Yield Curve During 2026
Mortgage rates are priced off the 10-year U.S. Treasury Yield, so mortgage rates have also increased over 1% since the beginning of the year and now sit well north of 7%. Housing was already incredibly unaffordable due to the combination of high prices and high mortgage rates, so this rapid further increase will do nothing to improve that situation for would-be buyers.
Situational (Un)awareness Liquidation
Leopold Aschenbrenner, a young, former OpenAI researcher, runs a hedge fund called Situational Awareness that focused on long and short investments guided by his view of how Artificial Intelligence would impact related stock valuations. After generating extraordinary gains from concentrated AI infrastructure and semiconductors investments, the fund ran into severe trouble during July’s selloff in AI-related stocks. Exacerbating the situation, the prices of software stocks, their preferred hedging instrument, shot higher causing losses in their short positions as well. Ultimately, the drawdown triggered margin calls from the fund’s lenders and forced Situational Awareness to sell most of its publicly traded stock portfolio, including a large block to Citadel.
The episode illustrates how leverage can transform a large, but manageable, investment loss into a liquidity crisis. Supposedly, the fund was allowed to be up to 4x levered. This means each $1 of investor capital could result in $2 of long positions and $2 of short positions. A 4x levered strategy can generate astounding returns when things go well (the fund was up ~450% YTD prior to the correction) but can suffer equally dramatic losses when the market moves against you.
Figure 6: Representative Long & Short Positions of Situational Awareness Portfolio
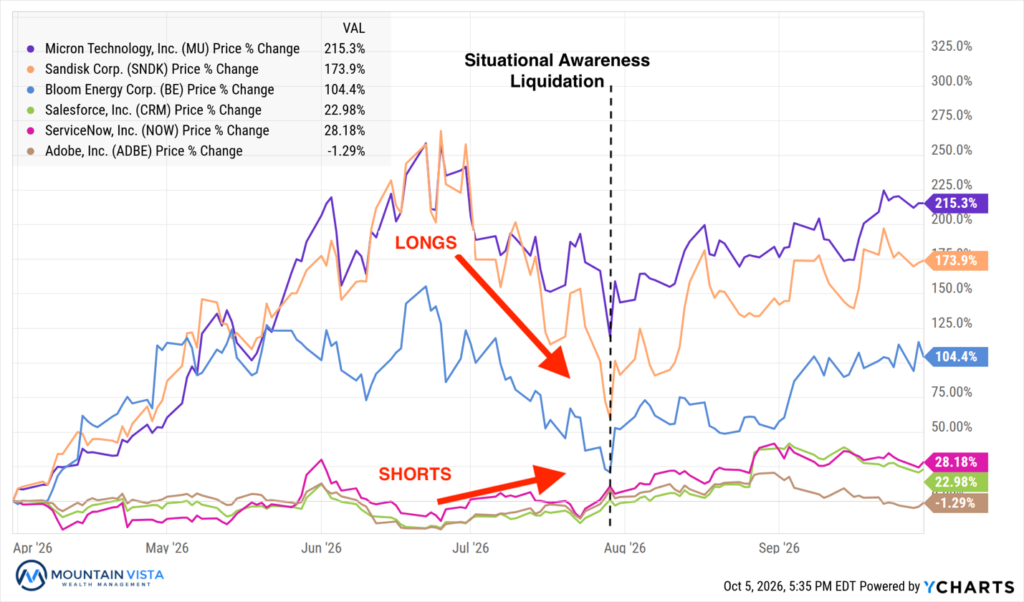
There is an important distinction between having the wrong long-term investment thesis and having a portfolio that cannot survive short-term volatility. The fundamental outlook for Artificial Intelligence may ultimately prove as compelling as Situational Awareness believed, but leverage and position concentration dramatically shortened the amount of time the fund had to be right.
The Situational Awareness episode is therefore a useful reminder that successful investing is not simply about identifying attractive opportunities; it is also about structuring a portfolio so that temporary volatility does not become permanent capital loss.
Why Stocks Are Holding Up So Well
Rapidly increasing bond yields, never-ending wars, inflation, housing affordability, socialism, fascism…there is no shortage of reasons to be concerned about the state of world. Yet the stock market keeps cruising along, shaking off each challenge with only a minor set-back. How can stocks be performing so well, when there is so much uncertainty?
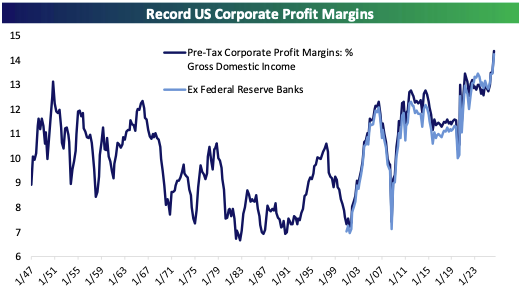
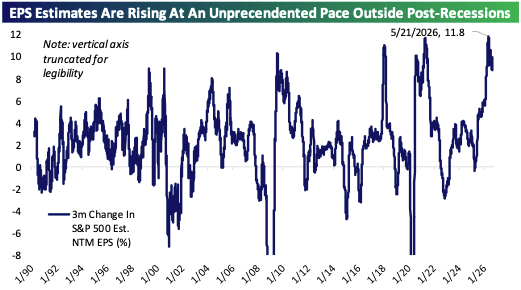
First, what the stock market cares about most is earnings and corporate earnings are doing VERY well. Heavy investment in AI infrastructure, tariff refunds, deregulation and worker productivity are all stoking topline revenues and allowing more cash to flow through to net income. In Figure 7, you can see that corporate profit margins are at record levels and earnings estimates are being revised higher at rates commensurate with the end of COVID.
Figure 7: U.S. Corporate Profit Margins and 3-Month change in Next 12 Month EPS
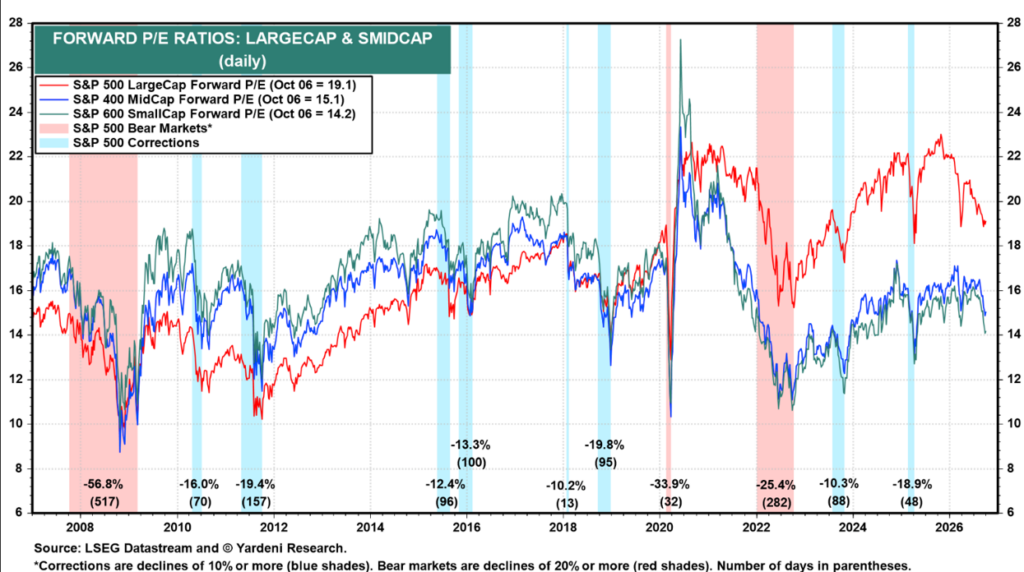
Second, the S&P 500’s valuation is surprisingly getting cheaper as its price is going up slower than earnings are growing. Since peaking at ~23x in late 2025, multiples have contracted by ~4x to 19.1x. This is not cheap from a longer-term perspective but is much more reasonable than the last few years.
Figure 8: U.S. Index Forward Price-to-Earnings Ratios
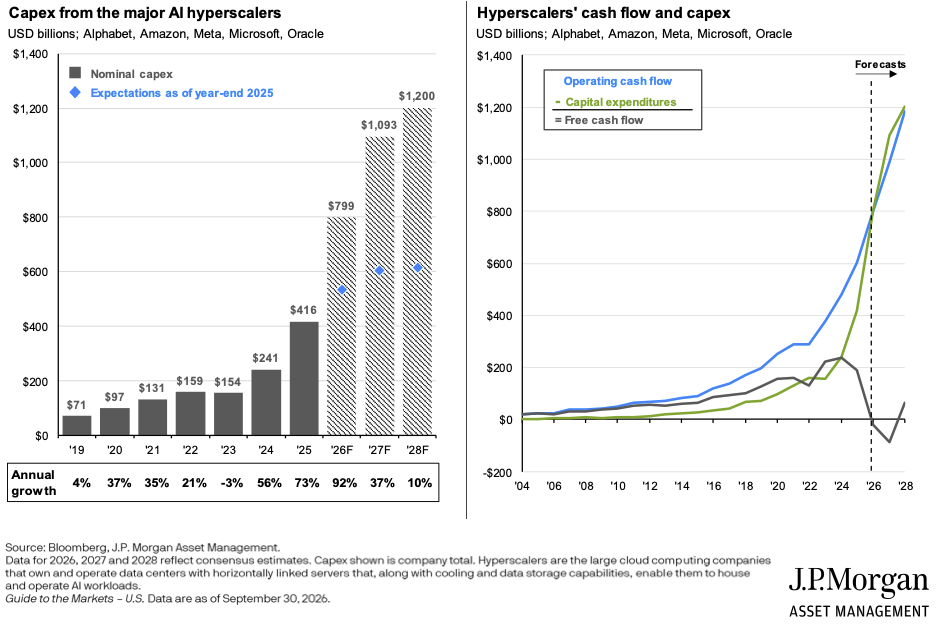
Finally, capital investment by the hyperscalers continues to ramp higher and beat expectations. Eventually, the profitability of this investment will need to bear fruit, but the money being spent today is boosting profits and economic growth.
Figure 9: Hyperscaler Investment and Free Cashflow
Looking Forward
We positioned growth portfolios back to neutral after the reset in stock prices during July. We are hesitant to underweight equities amidst such strong corporate fundamentals. Assuming we can get through October, the last two months of the year are historically very favorable for equities. This seasonal strength is even more pronounced in mid-term election years. Looking beyond the next few months, we are cautious about a sudden shift in AI/datacenter spending and/or economics. Given the power of the technology, I think the investment cycle is still in the early innings, but we are watching these trends carefully.
Government bond yields have jumped higher over the last few months. While this creates a short-term performance issue for existing holdings, it quickly makes fixed income a viable investment for retirees in search of income. Many retirees reference “the 4% rule” as a means of calculating a safe amount of spending over the course of a 30-year retirement. With 30-year U.S. Treasury Yields at 5.6%, government bonds can provide most of the retirement income without the volatility of equities. We think Fixed Income looks very attractive at current yields.
Last quarter we highlighted Gold and Bitcoin as being attractively priced. Gold only ended the quarter up 3% but was up as much as 16% in August. Bitcoin, on the other hand, skyrocketed 42% in the 3rd quarter. Moving forward, we think Gold is the more attractive asset class, but it will need real U.S. Treasury yields to stop increasing. Positive real yields make gold, a non-interest-bearing rock, look less attractive. We would be cautious on oil and related sectors here, as they require continued disruption and war to perform.
We appreciate your review of this analysis and welcome any questions regarding these observations or other financial matters of interest.
APPENDIX
Equity Index ETF Total Return
| ETF | Description | Q3 2026 Total Return | Since July 29, 2026 | 2026 Total Return |
| SPY | S&P 500 | 2.4% | 4.8% | 12.7% |
| QQQ | Nasdaq 100 | 0.6% | 11.9% | 20.8% |
| IWM | Russell 2000 | (7.3%) | (3.4%) | 13.7% |
| IVW | S&P 500 Growth | 3.5% | 10.1% | 15.7% |
| IVE | S&P 500 Value | 0.9% | (1.4%) | 8.9% |
| VXUS | International Ex-US | (0.4%) | 3.3% | 13.4% |
| IEMG | Emerging Markets | (2.0%) | 9.5% | 21.7% |
U.S. Equity Sector Total Return Table
| ETF | Description | Q3 2026 Total Return | Since July 29, 2026 | 2026 Total Return |
| XLE | Energy | 16.5% | 5.5% | 40.3% |
| XLV | Healthcare | 6.6% | 1.7% | 10.1% |
| XLC | Communications | 3.9% | 1.7% | (4.9%) |
| XLK | Technology | 2.9% | 17.7% | 36.5% |
| XLF | Financials | (0.0%) | (5.5%) | (1.3%) |
| IYZ | Telecom | (2.3%) | 4.1% | 22.9% |
| XLP | Consumer Staples | (2.3%) | (7.1%) | 5.8% |
| XLB | Materials | (3.8%) | (5.4%) | 8.8% |
| XLRE | Real Estate | (6.3%) | (10.2%) | 3.8% |
| XLY | Consumer Disc | (7.0%) | (2.3%) | (8.3%) |
| XLI | Industrials | (9.6%) | (5.2%) | 8.5% |
| XLU | Utilities | (12.4%) | (11.5%) | (5.7%) |
U.S. Equity Sector Total Return Chart
Global Equity ETF Total Return
Fixed Income ETF Total Return
| ETF | Description | Q3 2026 Total Return | Since July 29, 2026 | 2026 Total Return |
| AGG | Aggregate Bond | (3.5%) | (2.4%) | (2.8%) |
| BND | Total Bond Market | (3.4%) | (2.4%) | (2.7%) |
| LQD | IG Corporate | (5.2%) | (3.0%) | (4.4%) |
| JNK | HY Corporate | (2.1%) | (1.7%) | (0.3%) |
| EMB | $ EM Bonds | (4.6%) | (3.1%) | (2.3%) |
| SHY | 1-3 Yr Treasuries | (0.2%) | (0.4%) | 0.4% |
| IEF | 7-10 Yr Treasuries | (4.6%) | (3.5%) | (4.6%) |
| TLT | 20+ Yr Treasuries | (9.0%) | (5.4%) | (8.0%) |
| TIP | TIPs | (3.3%) | (2.8%) | (2.1%) |
U.S. Treasury Yields and 2/10 Spread
U.S. Corporate Credit Spreads
Commodity and Bitcoin Total Return
| ETF | Description | Q3 2026 Total Return | Since July 29, 2026 | 2026 Total Return |
| PDBC | Diversified Commodity | 21.5% | 9.8% | 45.7% |
| GLD | Gold | 3.4% | 2.6% | (3.9%) |
| DBB | Base Metals | 5.0% | 2.4% | 10.3% |
| USO | Oil | 36.8% | 12.6% | 110.6% |
| FBTC | Bitcoin | 42.3% | 31.4% | (4.7%) |
| ETHA | Ethereum | 69.2% | 41.3% | (10.3%) |
Disclaimer
The views and opinions expressed are for informational and educational purposes only as of the date of writing and may change at any time based on market or other conditions and may not come to pass. This material is not intended to be relied upon as investment advice or recommendations, does not constitute a solicitation to buy or sell securities and should not be considered specific legal, investment or tax advice. The information provided does not take into account the specific objectives, financial situation, or particular needs of any specific person. All investments carry a certain degree of risk and there is no assurance that an investment will provide positive performance over any period of time. Equity investments are subject to market risk or the risk that stocks will decline in response to such factors as adverse company news or industry developments or a general economic decline. Debt or fixed income securities are subject to market risk, credit risk, interest rate risk, call risk, tax risk, political and economic risk, and income risk. As interest rates rise, bond prices fall. Non-investment-grade bonds involve heightened credit risk, liquidity risk, and potential for default. Foreign investing involves additional risks, including currency fluctuation, political and economic instability, lack of liquidity and differing legal and accounting standards. These risks are magnified in emerging markets. Past performance is no guarantee of future results.